
First of all I want to wish you and your family a merry Christmas ! Enjoy the family time with your beloved ones.
Christmas period is the time in which people spend money to buy presents for family and friends. An European survey revealed that 1 out of 4 Belgian families spends more money than they can afford. The consequences of this financial behavior have a bigger impact one month later when regular bills can no longer be paid. Online shopping makes it easier these days as you don’t need to leave the house anymore.
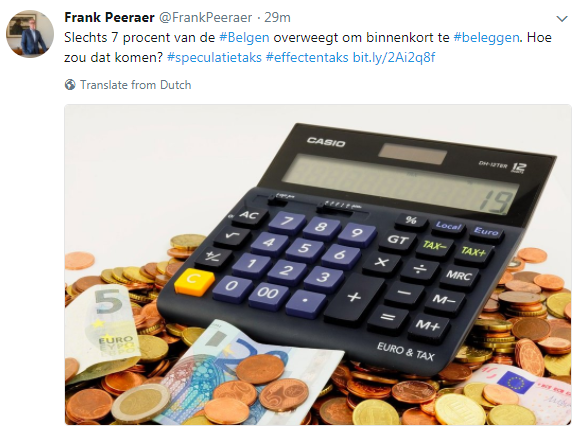
Debt collection agencies argue for the inclusion of financial management in the school curricula and I couldn’t agree more. Due to the minimum interest rate on savings accounts, more and more people no longer find it worthwhile to transfer money from the current regular bank account to the savings account. This can be derived from figures from the National Bank. On all Belgian savings accounts together stood at the end of October 258.3 billion euros. At the end of July it was still 258.6 billion euros. It has been the first time since long that the savings accounts total has decreased. The current bank accounts, however, did see money coming in, from 243.9 billion euros at the end of August to just under 253 billion euros at the end of October. In recent years banks have reduced interest rates on savings accounts to the legal minimum of 0.11 percent: a base rate of 0.01 percent and a fidelity premium of 0.10 percent. Despite these low interest rates, the savings books remained extremely popular. Frank Peeraer, CEO of Fortuna Financial Group tweeted that only 7% of the Belgian people considers to invest in the stock market. That percentage is lower than the 15% that VFB, Flemish organization of investors predicts. Why do people not invest in the stock market? One reason is the lack of financial literacy and knowledge. Who teaches this in Belgium? Tell me…
Another reason and one of the great demotivators is the increasing taxes of the Belgian government on investors. Next year the stock transaction tax increases to 0,35% per transaction. This means that for every buy and sell you pay the government 0,70% even if you close a losing stock transaction position. This tax is so cruel and unfair. It is a clear expression and invention of politicians who know NOTHING about investing money in the stock market. In addition of this stock transaction tax that now increased 3 times, CD&V political party added a version 2 of the speculation tax. It is sad that the other political parties agreed with all those increasing investor taxes. Going into 2018 we will adapt our investors’ behavior to avoid as many taxes as possible.
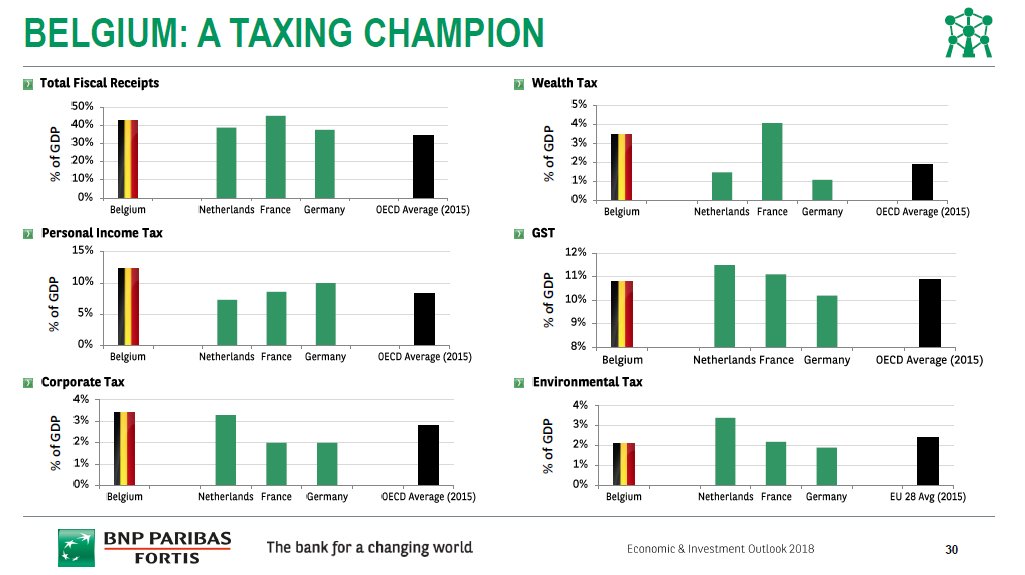
Why do politicians keep on inventing NEW taxes ? Shouldn’t they focus on cutting expenses instead of taxing more ? In Belgium we try to be the TAXING CHAMPION of THE WORLD while President Trump and other country governments start slashing taxes. Take a look at below chart and leave an opinion in our comments section…
So let’s go towards to our Market Analysis.
Market Analysis
When we analyse the performance of the SPY (screenshot 25 December) we can conclude that the bull market remains strong.
Wall Street has been cranking out 2018 outlooks as 2017 winds down, and plenty of them are super-wordy and conventional. So when a reflection on the upcoming year fits on a single page, it deserves a little attention. It’s Deutsche Bank that has circulated the list of 30 risks for markets in 2018 shown below. “They are in random order and are both upside risks and downside risks,” writes the bank’s chief international economist, Torsten Slok.
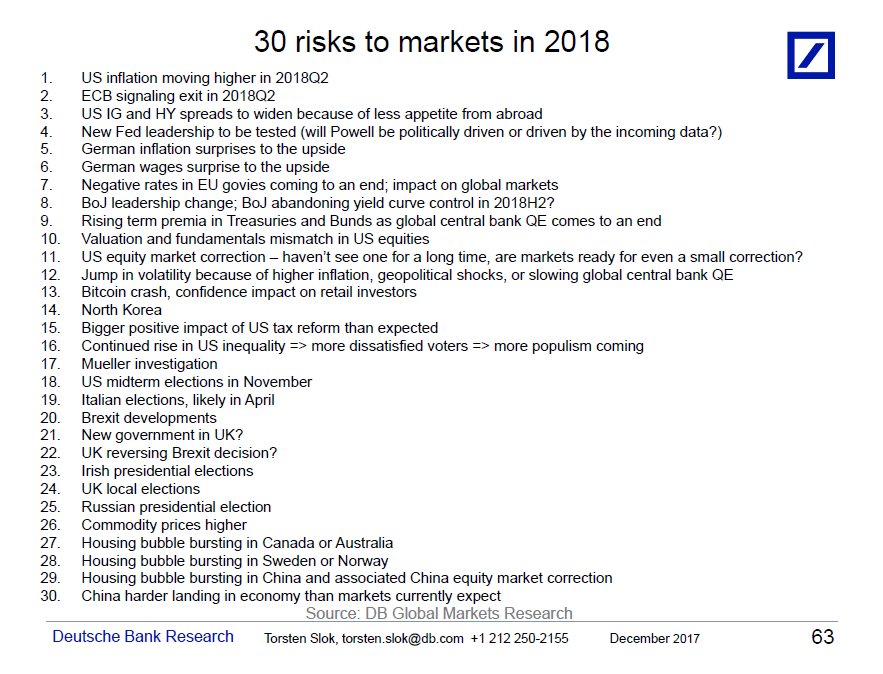
“Think of them not only as potential VIX-boosters, but also as potential sources of faster or slower growth than what we have in our baseline forecast,” adds Slok, whose team has predicted real U.S. GDP growth of 2.3% in 2018. On the upside, the positive impact from U.S. tax reform might somehow be bigger than expected, according to the giant bank’s economists.
Personally I think the cocktail of growing global debt with higher interest rates will result in a disaster. The Fed’s balance-sheet unwind spells big trouble. Take a look at the graph from Michael Lebowitz of 720 Global. It’s the S&P 500 overlaid with the Federal Reserve’s balance sheet and the forecast of where the Fed intends to take its balance sheet.
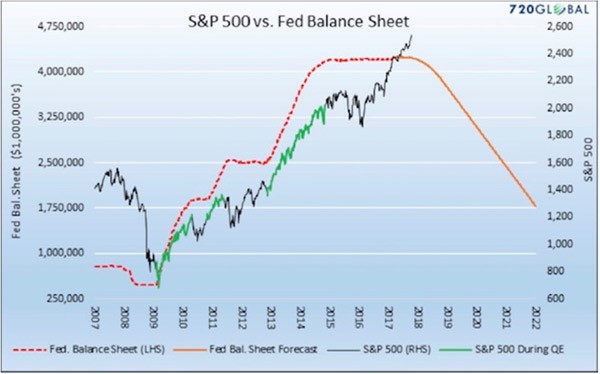
The Fed and other central banks have practically forced investors into risk assets since 2008. You can see the relationship clearly in this chart. The green segments of the S&P 500’s rise occurred during quantitative-easing programs.
Correlation isn’t causation, but I think we can safely draw some connections here.
Ample low-cost liquidity drives asset prices higher. That’s not controversial. It makes perfect sense that the withdrawal of ample low-cost liquidity would also impact asset prices in the opposite direction.
The Fed has even given us a schedule by which it will unwind its balance sheet. Michael’s chart gives us a sense of how far the S&P 500 could drop if the Fed unwinds as planned, and if the relationship between liquidity and stock prices persists. Either or both of those could change; but if they don’t, the S&P 500 could fall 50% in the next few years.
- Scenario 1 : Correction Down. We take a breather pullback to 254 or lower and then flush through that 254 level back down to 250. Similar move as Japan NIKKEI index past days …
- Scenario 2 : Consolidation phase. We go sideways between 254 and 260 before deciding direction in next month
- Scenario 3 : We pull back a litte this week before breaking that 260 level and go higher according to trendline
Well..scenario 3 played out perfectly.Do you see how it follows nicely the trendline ? I also placed 4 Exponential Moving Averages (EMA’s) on the graph. I will explain in future blogposts how I will use them. ![]()
Let’s dive in the numbers of my November Dividend Income Report.
Options Income & Dividends received in November 2017
Last month we changed the title of the section. Yes, we earned our first Options Income money !! Well…this month we earned again options income. A total of 291,91$. Not as much as last month but nevertheless we are happy. In November we received a total of 581,39$ dividend + options income. We received 289,48$ from from monthly paying stocks and ETFs. Another solid month. Thanks to the options income we did hit our monthly objective of 300$ per month.
Below you see the monthly summary overview of the cash flow coming into my bank account.
![]()
Portfolio Analysis and Growth
No unpleasant surprises and changes in our portfolio. Nothing to report.
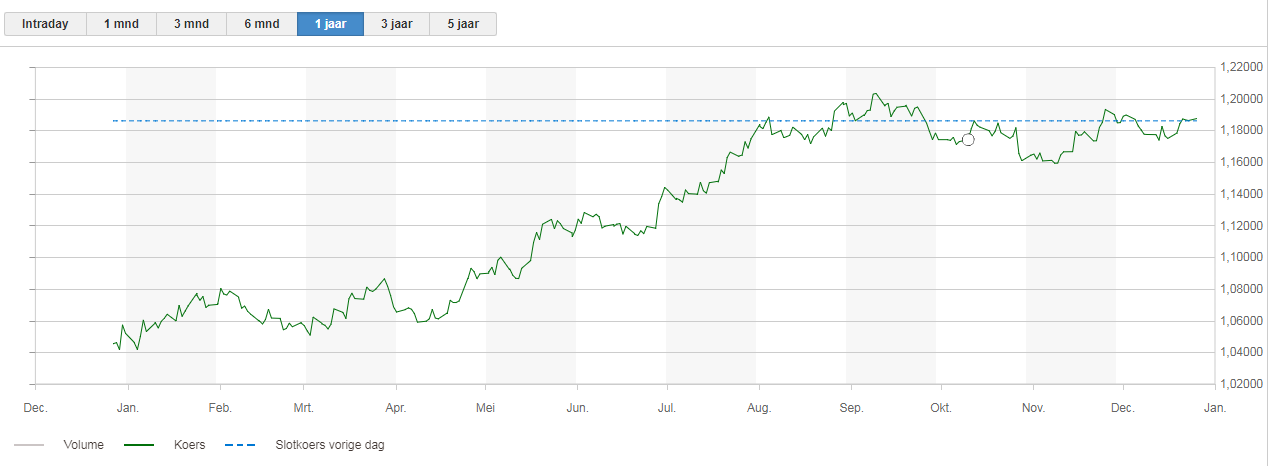
The Euro/Dollar trend
We keep on following the EURO/USD valuation. The EURO remains floating between the 1,16 and 1,20 price channels. Personally we expect the dollar to become stronger but we will see. Going into 2018 it will be interesting to see if the EURO breaks the 1,20 price level.
Going forward
Only several days to go for the year 2017…and we did a SMART objective of 6600$ for 2017 and we did break our yearly objective. I don’t believe the market will crash in the last week of the year. In the meantime the december dividends keep on coming in on my bank account.
Will we break the 10.000$ next month ? That would be a great achievement…we will report out in January 2018. Now we have a total of 9.237 $ CASH received from our investments.
Below you can see the detail summary table of our monthly payouts including losses and the new row Options Income.
![]()
What do you think about our monthly performance ? Did you receive equal cashflow money on your saving account ? Don’t hesitate to leave your comments and feedback. Let us know what you think.
Good luck with your personal finance strategy! As usual we end with a quote.
Sources : Marketwatch

No Comment
You can post first response comment.