
The end of June is coming close and past week the summer has started. During past week I read an interesting headline…

When it comes to the take-home pay of the average worker, the United States barely cracks the top 10, trailing several of the European countries that tend to pop up on any number of “most desirable” lists. According to data extracted from the 35-member countries of the Organization for Economic Cooperation and Development, Switzerland owns the top spot with after-tax earnings of $58,864 per worker. The U.S. is way down the list at $39,211. Belgium is behind the US with an average earnings of $34,834 per worker. Taxes are incredible high in Belgium!
Cost-estimating website HowMuch.net used the numbers to create a pie-chart for some perspective. The overall size of each slice refers to the level of gross earnings, and the green portion represents net income after taxes. The difference between these two figures is shown with dark red for income-tax rates and pink for Social Security taxes.
The average net earnings across the entire OECD is $32,624.Check out where your country is and how your after-tax earnings compares against other countries. 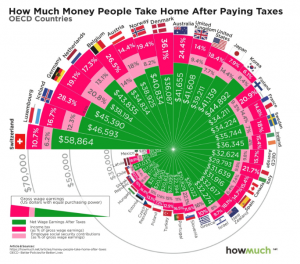
Market Analysis
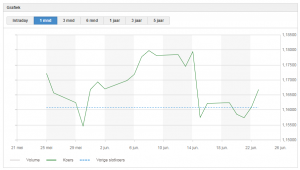
When we analyse the performance of the SPY (screenshot 24 June) we noticed an upwards trend channel. Although the S&P500 index was down by 0,9% for the week, the Nasdaq and Russell 2000 created new highs.
The markets are working off an overbought situation. The probability of a continued rise is much higher than for a decline from here. Opportunities remain very plentiful but you just need to know which sector and which stock to look for….
![]()
It will be interesting if the trend can sustain and we can reach new highs in July.
Let’s dive in the numbers of my May Dividend & Options Income Report.
Options Income & Dividends received in May 2018
In May 2018 we received a total of 501,05 $ passive income. We received 261,16$ dividend income from monthly paying stocks or ETFs and 174,06$ from quarterly ETFs. AGAIN no options income as our portfolio is still not transferred to our new broker. We did receive a yearly dividend of one European company.
Below you see the monthly summary overview of the cash flow coming into my bank account.
![]()
Portfolio Analysis and Growth
So far we have 3396,54$ passive income for the year 2018. Last year we received a lot more dividend income as we owned a lot of quarterly paying ETFs. Can we catch up going forward ? We will see…
![]()
We have 34% of our yearly objective in the books. Not good enough for me :-(( We are still 6900$ short from our objective.
The Euro/Dollar trend
We keep on following the EURO/USD valuation. No news for EUR/USD valuation.
Going forward
In the coming month I will focus on the transfer of our portfolio and continue to learn the trading platform at the new broker. We will work out a strategy to still meet our target for the year. Now it’s time to join my sports fanatic wife and watch the second half of the most important game in the world cup Poland – Colombia. Do you know the two players in the blog post pic ? Add them in the comments… Enjoy the World Cup in Russia and may Belgium win the World Cup in 2018 !!
Did you receive equal cash flow money on your saving account ? Don’t hesitate to leave your comments and feedback. Let us know what you think.
Good luck with your personal finance strategy! Thanks for following us on Twitter and Facebook and reading this blog post. As always we end with a quote.
Sources : Marketwatch

No Comment
You can post first response comment.