Welcome to our February Dividend Report Out. March is progressing fast while we review our February 2017 performance. With our travel to Paris and Lviv in Ukraine we had a busy month of travel behind us. You may wonder why I use a picture of a SICK tomato plant….I suggest you read until the end….thanks!
On the 1st February prices always changes in Belgium… here are some examples.
- Public transport becomes more expensive. Train tickets +2,,93% on average. Some tickets increase with 3,38%
- Beer prices were increased. (Thank God, I love wine more than beer)
- Some banks dropped their savings rates to 0,10 % instead of 0,11%….you get less and less money for putting it on the bank…
- Banking fees go up ! BNP Paribas Fortis makes the monthly fees higher to 3 Euro per month. You have to pay more for using a bank…time to search another bank I would say. I don’t pay any money.
- Telenet, internet provider increases his prices again. Internet prices are amongst the highest in Europe due to the duopoly of Proximus and Telenet. Crazy…
So with all those monthly expenses going up, it is CRITICAL that we stay on top of our Portfolio performance and our resulting Dividend passive income.
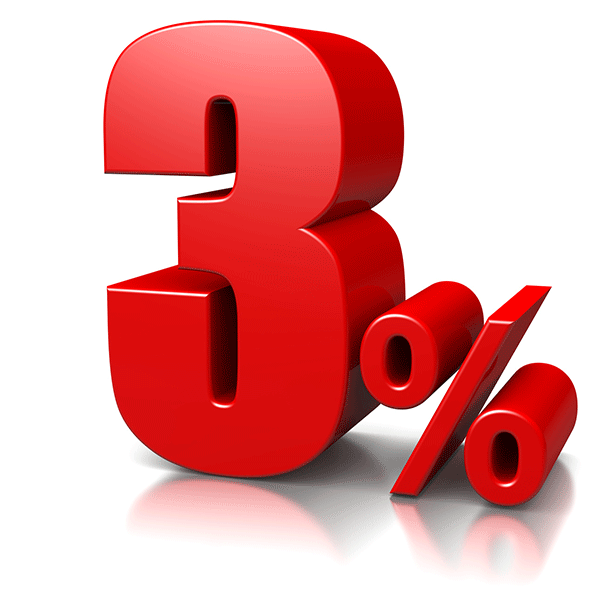
On our Facebook page, we shared an article where we said that you need at least 3% return on your money in order to beat the increasing inflation. That is the minimum KEY METRIC you should have for your investments. If your money doesn’t generate 3% return, you are losing money or with other words you get poorer. We also share articles of other bloggers on our Facebook page. Follow us !
Below you can read my second 2017 passive income Report Out of my own personal portfolio. Going forward we have decided to compose our Dividend Income report of our Own portfolio with three standard chapters :
- Market analysis
- Our Dividend Performance and Growth, and..
- Forward Looking statement with a QUOTE.
We hope you like that approach. Leave your comments at the end. We appreciate that !!
Market Analysis
Early February 2017 a chief market technician Jonathan Krinsky declared on CNBC that February would be a tough month ahead for stocks. Krinsky points out that over the past 40 years, February has been the S&P 500‘s weakest month within the generally strong November to April period; stocks have risen a mere 0.06 percent in the average February, according to his work. The short month has been crueler in years following elections. In the postelection Februaries since 1977, the S&P has fallen by 1.85 percent on average. To his historical analysis Krinsky mixes in the fact that the market has gone 75 days without a daily decline of 1 percent or more. To him, this suggests that a slide of such magnitude is ahead — and “once you have that, you tend to see weaker-than-average returns over the next couple weeks.”
All in all, Krinsky expects to see the S&P slip 3 to 6 percent in the weeks ahead. This dip would serve as a “welcome buying opportunity,” he added Monday on CNBC’s “Trading Nation.”
So let’s see what happened…
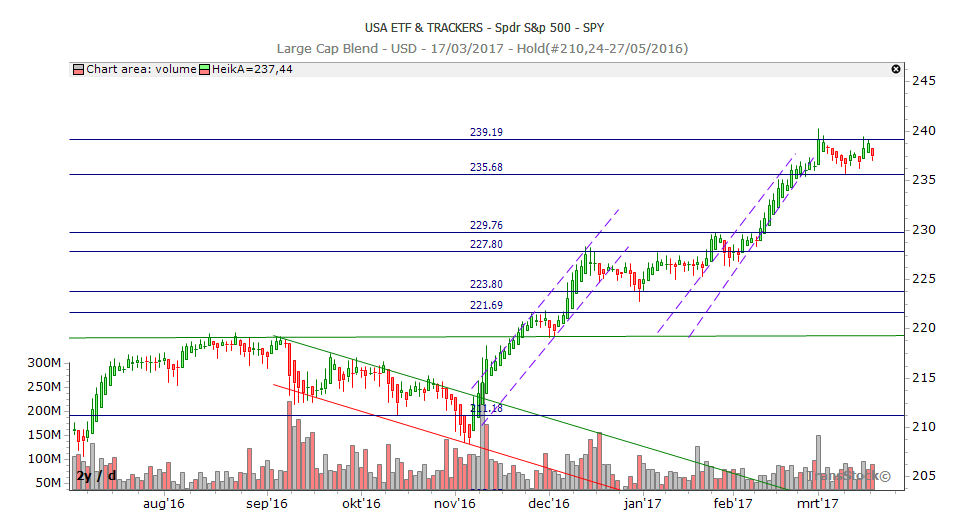
I always use the SPY (S&P 500 ETF) as a reference. The SPY rallied from 228 to 239 in a strong uptrend channel. No weakness, no slippage of 3 to 6% but a strong upwards trend channel. See the graph. The breakout of 229 was ANOTHER STRONG buy alert for those who didn’t put their money at work. This is how you need to learn how to read the graph. Learn the basics of technical analysis. The level 235 is the support line now. If we break out above 239, we are going another level up…Only a geopolitical conflict or any other event can cause a correction. Stocks may seem high and everyone expects a correction but central banks such as ECB keep on pumping money in the system. Interest rates will remain low for a long time as governments have too much debt.
There is simply no alternative at this moment…and no reason why we will go down. We expect another boost up when Trump will announce his tax bill cut for US companies. There may be a little correction down. But you always need to think on the longterm instead of focussing on short term risk.

This upwards trend has been reflected in my portfolio capital gains. On average stocks and ETF’s rose with 2 to 5% in value during the month of February. We didn’t purchase any new stocks during this month.
Another conclusion that I already knew and you should also know, is DON”T LISTEN TO ALL THOSE MARKET ANALYSTS AND MARKET GURUS!! The PAST PERFORMANCE is never a REFERENCE for the FUTURE. If they are right, they will always explain it with some graphs and their analysis. Never when they are wrong…then it will remain silent…they are paid for making the market analysis stories…not for being right…remember! Nobody can predict in the future…
Dividends received in February 2017
Dividend income is amazing. So how did our portfolio perform this month ?
January was a RECORD month of passive income of all months before. February was a solid month with a dividend total of 423,18$. 300$ per month is our 2017 goal and benchmark and we achieved this result. Happy about that !
![]()
Now let’s analyze the breakout of monthly versus quarterly paying dividends. We earned 262,46 monthly dividend versus 160,72$ quarterly. We now earned a total of 1954,05$ for the year 2017. That is almost 30% of our yearly target. Great progress !
You can read our 2017 financial objectives here.
![]()
Portfolio Analysis and Growth
Our dividend income has grown nicely compared to previous years. We doubled our February cashflow income basically compared to 2015. But nothing comes for free…you need to stay on top of your cash flow factory.
During the month of February, we had to take action in our Portfolio. (Step 5 in our Financial Strategy)
A healthy portfolio is composed of different stocks and ETF’s paying dividend. You can compare it with growing tomatos and tomato plants. You can NOT guarantee that each plant will generate the juicy tomatos that you love to eat. Well this month I had to eradicate one of my tomato plants who was sick….
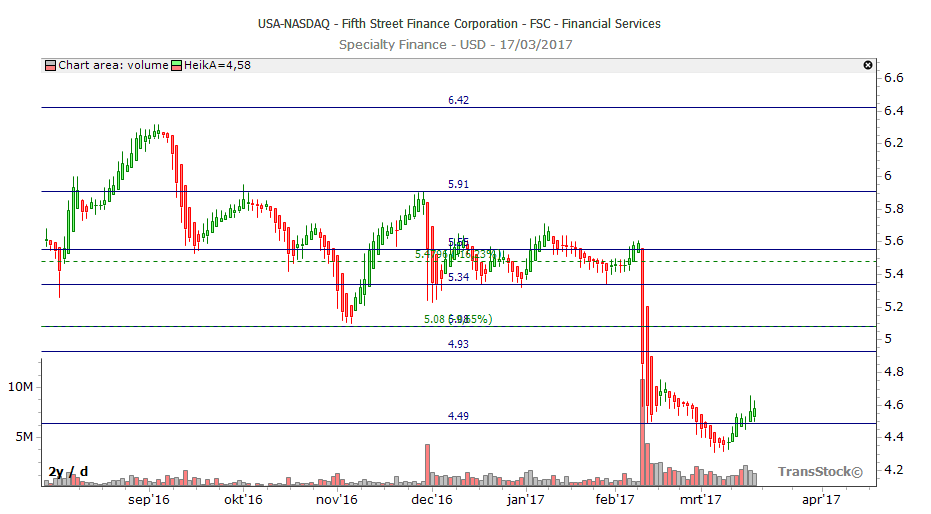
One of our high dividend payers (Fifth Street (FSC)) reported bad company results (a loss due to bad management) and a dividend cut in their dividend payouts. Investors expected a stable dividend payout, good company results and a move of the stock towards 6$. Reaction on the stock market followed immediately after the news release and investors kicked the stock out of their portfolio. SO did I !! You can see this on the graph on the big red candles. We lost a few hundred dollars on this stock. Cut losses quickly is important !! Losing the support of 5,34 (or even 5,08) was a SELL signal. You can not always be a 100% right in your choices of dividend paying stocks.

In our Financial Strategy we explained STEP 5 Portfolio Analysis. This is a perfect example of following up and taking action when needed. Kick out a bad performer immediately !
If you look at the growth of our dividend income for the month of february compared to previous years, we basically doubled our money income compared to last year. Happy about that result!
Going forward
We are now mid March 2017. Our Dividend Income together with our sell of FSC gives us another 5k purchasing power. In March we will review several opportunities to accelerate our passive income.
In February we have collected all information about the stock market taxes. We will write a separate blog post about that experience and our key findings.
Thanks for reading our blog post. We hope you made more passive income than us. If not, keep on hustling and grinding. Invest in yourself !
We end with a filosophical quote. You can use this quote for your financial literacy, your other skills in your job, your relationship, your finances,…anything.
Good luck with your personal finance strategy!


3 Response Comments
Great progress from your dividends and hitting a nice chunk of your yearly goal too. Your chart is painting a nice picture. Keep up the good work.
Thank you very much !! Staying focused on increasing that monthly amount :-))
Your honesty is like a beacon