
A few times a year I try to slot in an investors or trading event where I can learn new investor or trading strategies. VFB organized an interesting agenda “Technical Analysis” day full of different trading topics. More than 100 interested investors sacrificed their Saturday to attend this event. This was the last event I attended before the lock down due to the corona virus.
Below you can find our summary.
Technical analysis is a means of examining and predicting price movements in the financial markets, by using historical price charts and market statistics. It is based on the idea that if a trader can identify previous market patterns, they can form a fairly accurate prediction of future price trajectories. This time, the VFB spiced up the agenda with options and cryptocurrencies.
Stock Market Outlook 2020 by Paul Gins (Compugraphics)
Paul opens the day with a technical view on the S&P500. What will be the economic impact of the corona virus ? We must always use the S&P 500 as the main global index. Hang this chart above your bed is Paul’s advice.
We are talking about less global growth from 2.9 to 2.5%. And suddenly there’s a FED rate cut. Will there be a bear market ? Central banks will try to avoid this with all means. When you look at the stock markets, you can look at the market sentiment.  We count the different stocks. 200 MA is now a resistance.
Stock markets have declined but most stocks are still above the 200MA. America is going up since 2009. Eurostoxx market sentiment is much weaker. When you review the heat map of recent declines, you can see that the decline in Europe was bigger than in the US. The US decline was only -9% versus -19% in Europe.
So you should always invest in the strongest market. How about China ? -1,64%, This tells you more than reading bad stories on the internet. The 55 Simple Moving Average (SMA) is for S&P 500 is at level 3050. You can also apply Fibonacci levels. When you connect highest top with the low, the most important levels are 50 & 61% levels.
So what does this mean for your portfolio ? Don’t start to buy as we could decline to the 200MA. Paul shows the public how to draw trend lines and support/resistance lines on the BEL20 index and other indices. Let’s take a look at commodities. Did you see what happened to oil and copper ? The demand has declined.
Don’t go LONG. OPEC couldn’t agree to lower production to support the oil price. Poetin has declined the oil production cut.
Silver price is not doing anything. Gold 1600 – 1800 zone is now being tested. Gold miners have a difficult time, but when the gold price goes up, gold miners will follow. So how can you manage your portfolio in declining markets ? There are always interesting stocks to follow. You can take a look at Rentokil. Can you manage your emotions and the volatility?
You can close your portfolio at a loss. It doesn’t matter at what price you buy. Winners always have a plan, losers have always an excuse.
Score with Options by Hamish Maertens (Option Generator)
First of all, you need to reduce risk and protect your portfolio, before playing around with options. Hamish is a big proponent of investing the boring way, in low volatility shares.
How can you use options and invest in a boring way. There are long call strategies, and also covered calls.
Most people want big returns and this means big risks. If you would focus on strong performance companies in each economic business cycle, you don’t need to worry. For example : VGP is a company who can perform in good and bad times.
Low volatility stocks perform on average the best. So what’s the options strategy ? Buy Long call options and sell short term calls so you can reduce the investment and reinvest the money. After 3,5 years we have regained our investment. The goal is to earn 3% per month.
Today there’s a lot of volatility and turbos is not the best option With current high VIX, you can regain your investment faster. Do not invest in LONG call options for your complete portfolio.
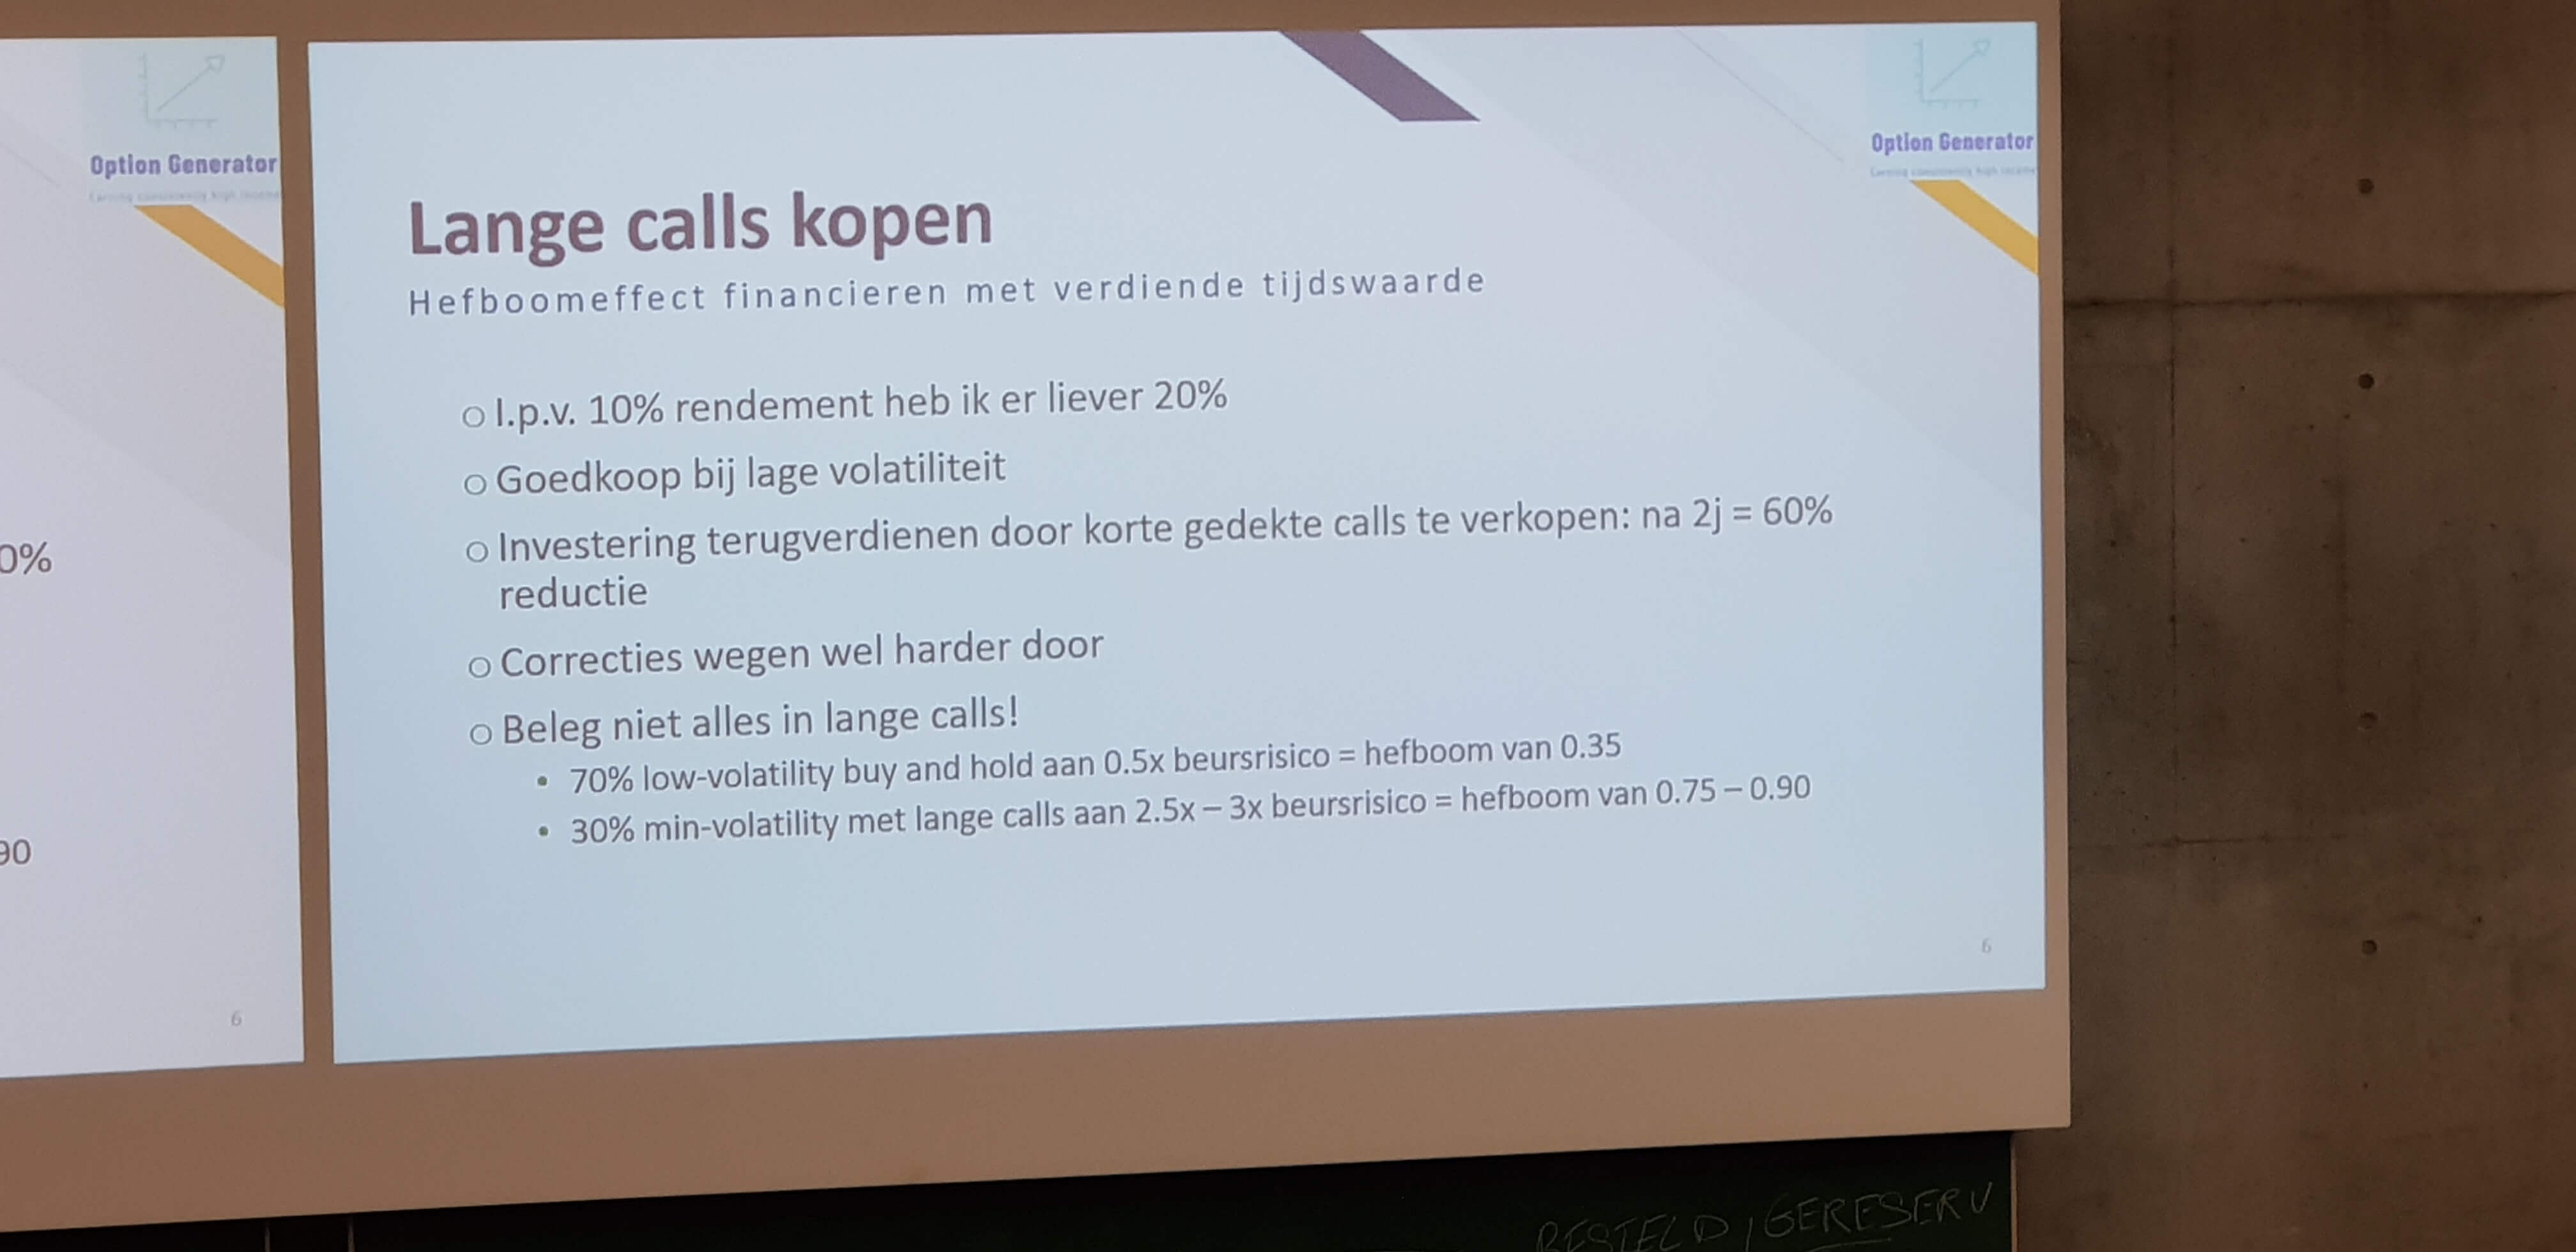
70% low volatility buy and hold with 30% min volatility with long calls is the best approach. You have less risk with an option. How do you execute the stock selections ? Focus on monthly graphs. Oil stocks have been declining since a few years. Never catch a falling knife
Focus on the winners and not the losers. Utilities sector can be an opportunity for the future. Stock selection is done based on fundamental qualitative analysis. It is also based on technical analysis (MACD & MA’s)
When we look at long call examples, we have VISA, ASML, AWK, MSFT, SHOP..
American Waterworks has performed well. Within the stock market, there are always companies that outperform. Investors are more shifting to low volatility stocks. Shopify is performing well. NEE is a boring energy utilities company with low volatility. VISA, Mastercard are also good performers. VISA has seen a decline of 3% but fundamental there’
ZTS -> 153 $. MSFT buy signal was last year. Hamish walks the public through the complete portfolio. The Long calls options strategy is explained on the blog Option Generator.
The Presentation : Hamish Maertens Option Generator
Technical analysis & Emotions by Ad Nooten (ADN Beursanalyse)
Ad is the founder of the website www.adnbeursanalyse.nl
Most investors are losing money because they lack the right decision processes. 75-80% of the people are losing money. An average investor starts with the wrong mindset of greed. It’s not that easy. When things go wrong, the retail investor has the following 5 kind of emotions. Immobility is one emotion of the five. A blocking mindset is the result of strong volatile markets. bigger losses, .. What is SMART TO EXECUTE ?
How you deal with your emotions, has an impact on your decisions related to your investments. There are different events such a s brexit, trump tweets and other events which impact directions. Ad is using meditation to relax and look neutral to the stock markets. You have also self reflection which impacts decision making. Negative thoughts lead to wrong decision making. We need to have a mindset like Obama and think YES WE CAN
Stock markets are open 24/5. So the risk is that you are overtrading. You can chose among 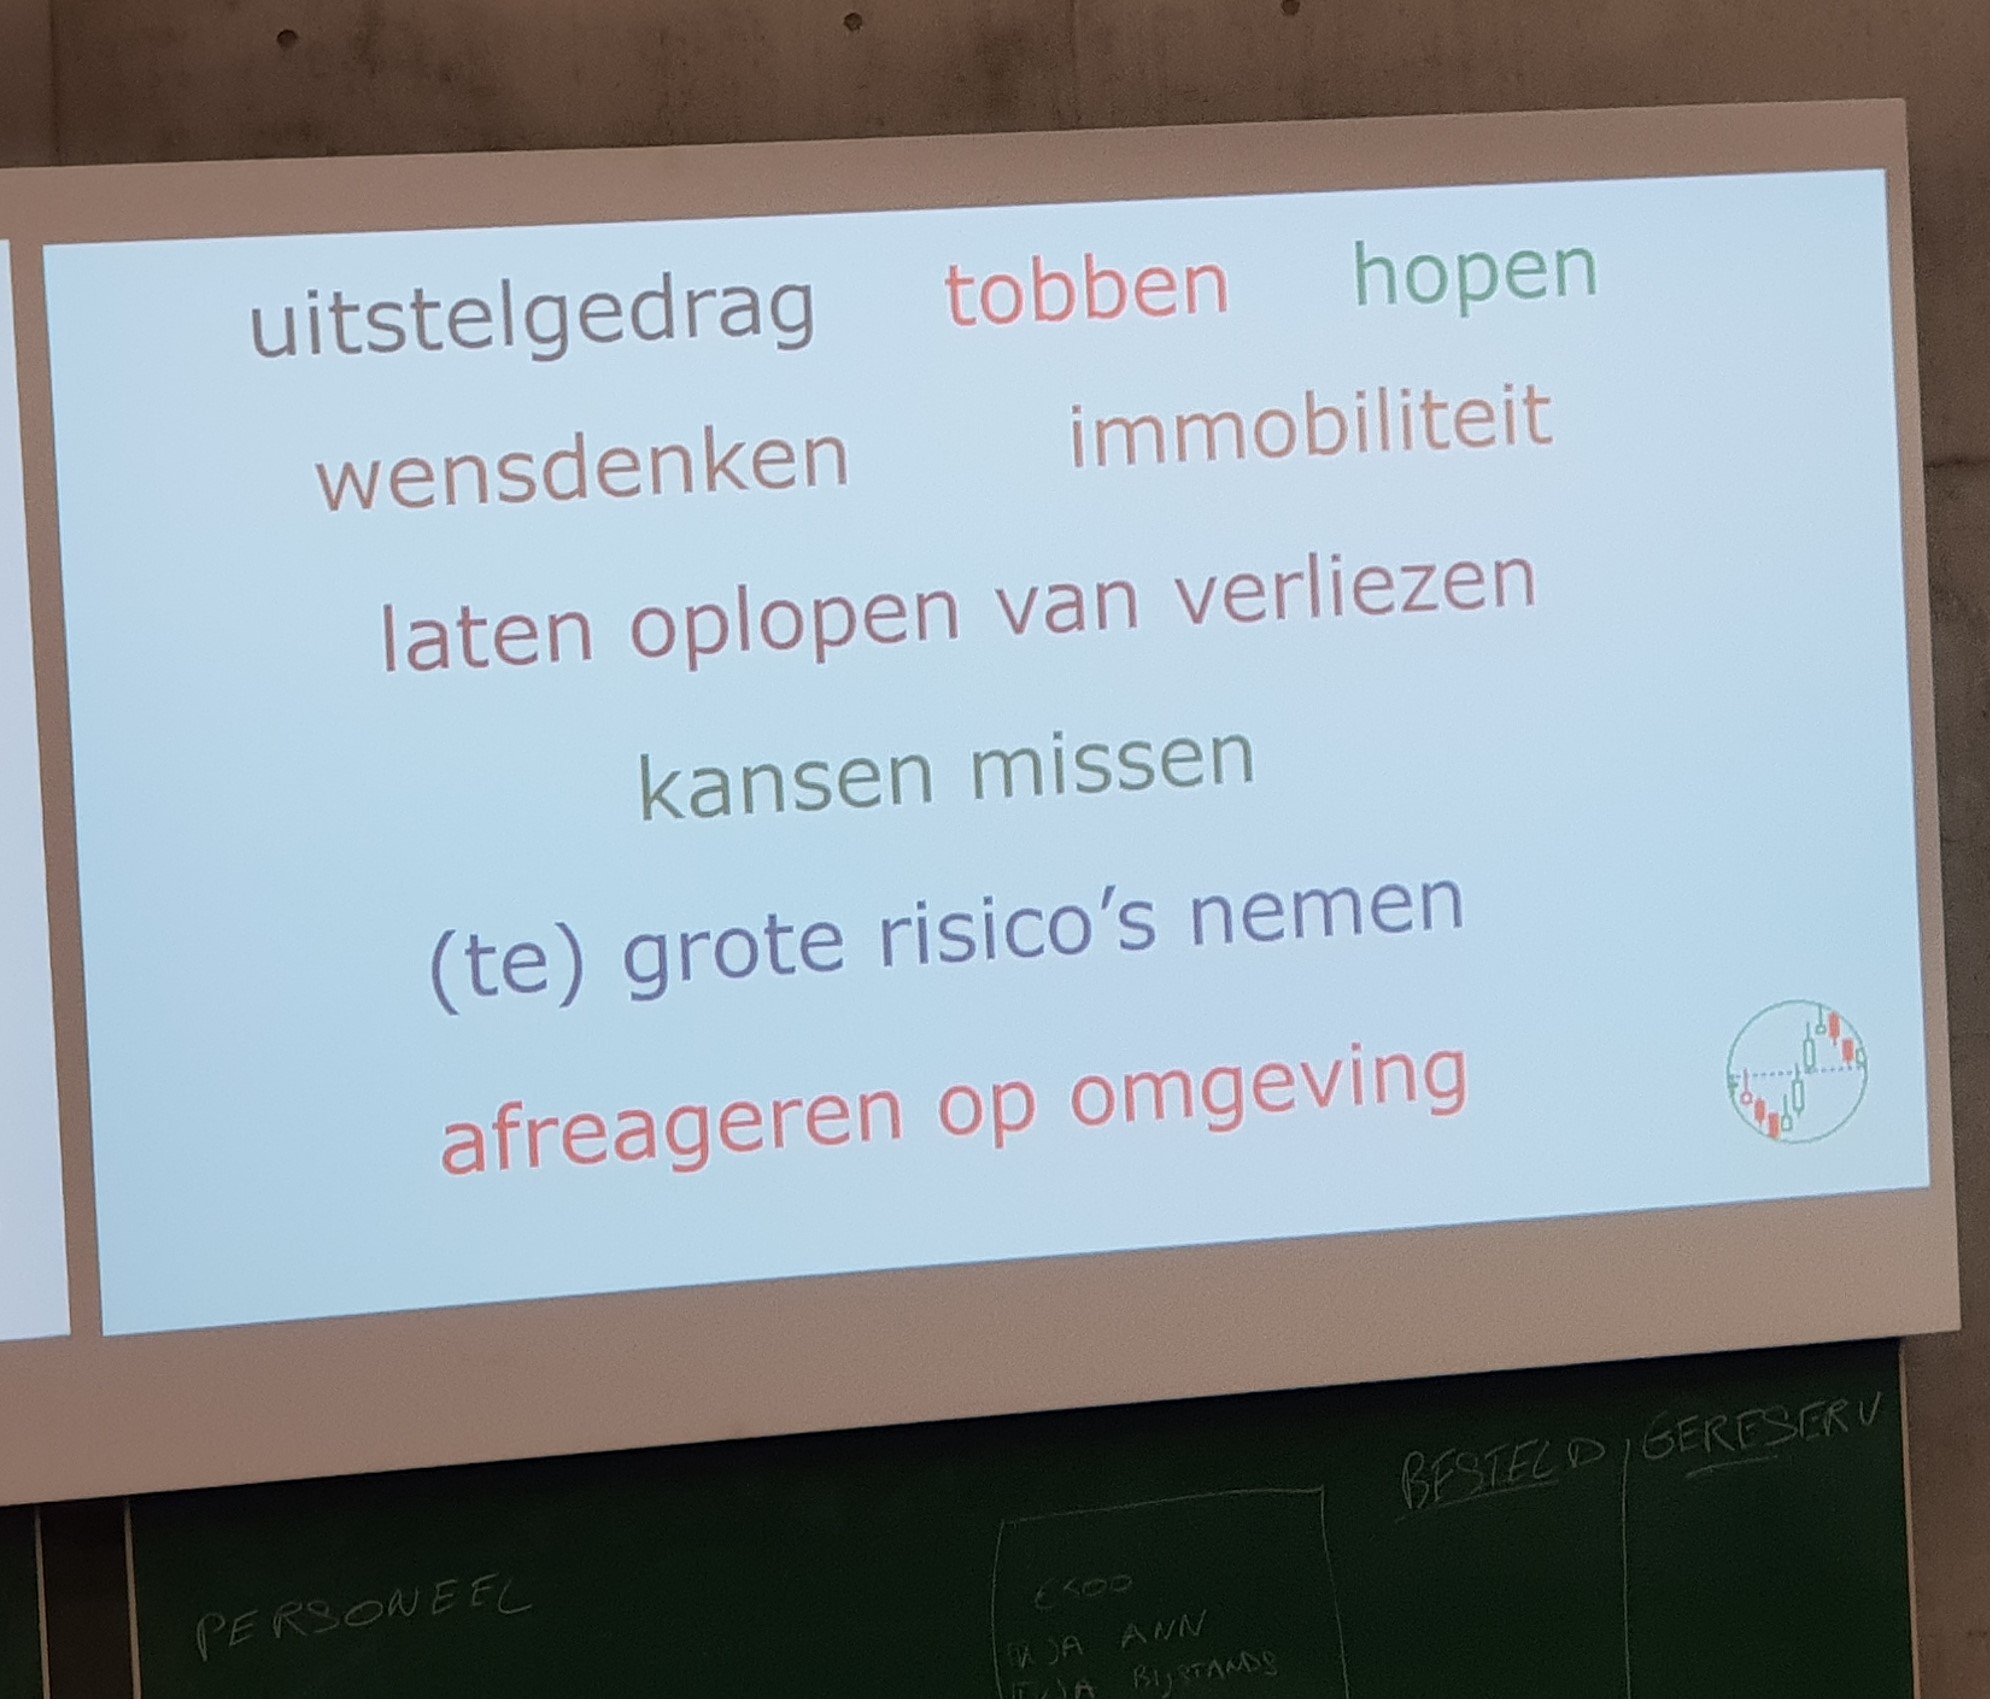 many financial products. So you can invest and/or trade within different markets with different financial instruments. Now you can also use apps. The barrier to invest and/or trade is lower and lower.
Who are your competitors ? The trading desks of banks who have an economist, technical and fundamental analysts, …
So there’s danger… as you don’t possess that knowledge. So that leads to risk. What is your trade/investment plan ? Where ? When and What ?
Ad is a big promoter of a trading/investors plan. What do we need ? Entries, target points and Stop loss (SL) levels. The distance between all those levels is critical. This is risk/reward. Ad does this based on head and shoulder patterns. Ad explains this patterns on the graph of NN Group.
So what is Ad’s vision on the markets ? Ad doesn’t have a vision and never predicts the markets. He does scenario planning. In scenario A and he breaks this level, he defines risk/reward. In scenario B, he uses another plan with TP and SL. Everything is prepared.
So your execution plan needs to contain a technical analysis, execution plan and scenario/mental plan. This leads to success.
The Presentation : Ad Nooten – Technische analyse en emoties
The Cannabis sector : Follow the SMART money by Kevin Verstraete & Ruben Pover (LYNX)
What is SMART MONEY ? You probably think it’s difficult math.
Do you know ATS : alternative trading systems? That is dark pool trading for US and Canada. Anyone watched the series “Billions” on Netflix ? Based on an information purchase, the hedge fund manager executes a trade which goes against him. In dark pool trading, people can execute with anonymous high volumes. This dark pool trading has increased from 35 to 45%.
Within the cannabis market, Kevin has analysed the dark pool trading on specific companies. (Source: Stock watch) What is extraordinary, are the volumes within this sector. Those volumes will most likely increase in the US stock market. Now we review BLOCK trades from 1M to more. Let’s take a look at Canopy Growth. Three block trades that were significant in size. Why would a hedge fund enter in such a big block trade ? This is very simple…maybe they had insight information.
 Kevin reviews two other block trades which can either be a buy or sell as there’s no visibility. Retail investors when they see a 20% increase, start to feel FOMO (fear of missing out) and then step in. But is this a wise investment decision? Did we found the Holy Grail with those block trades ? The answer is NO. Most trades these days are done by computer algorithms. This makes market prices more predictable. The cycle of market emotions leads to bad decisions of the retail investor. The best way to control your emotions is by using an ETF. Ruben walks through the roller coaster chart of this ETF.
Now let’s review technical analysis. ATR, MACD, ichimuko cloud are all indicators. Always focus on the PRICE and TREND. THE TREND IS YOUR FRIEND !
Here’s the process.
1. First analyse the trend. Are we going up or down ?
2. What are the key levels of support and resistance ? Kevin shows the levels for Aurora Cannabis
3. What are the supply and demand zones ? You can find those based on the red candles. Who’s moving the price ? It’s smart money that is moving the price.
When the price comes back in the demand zone, we see the buyers coming back in.
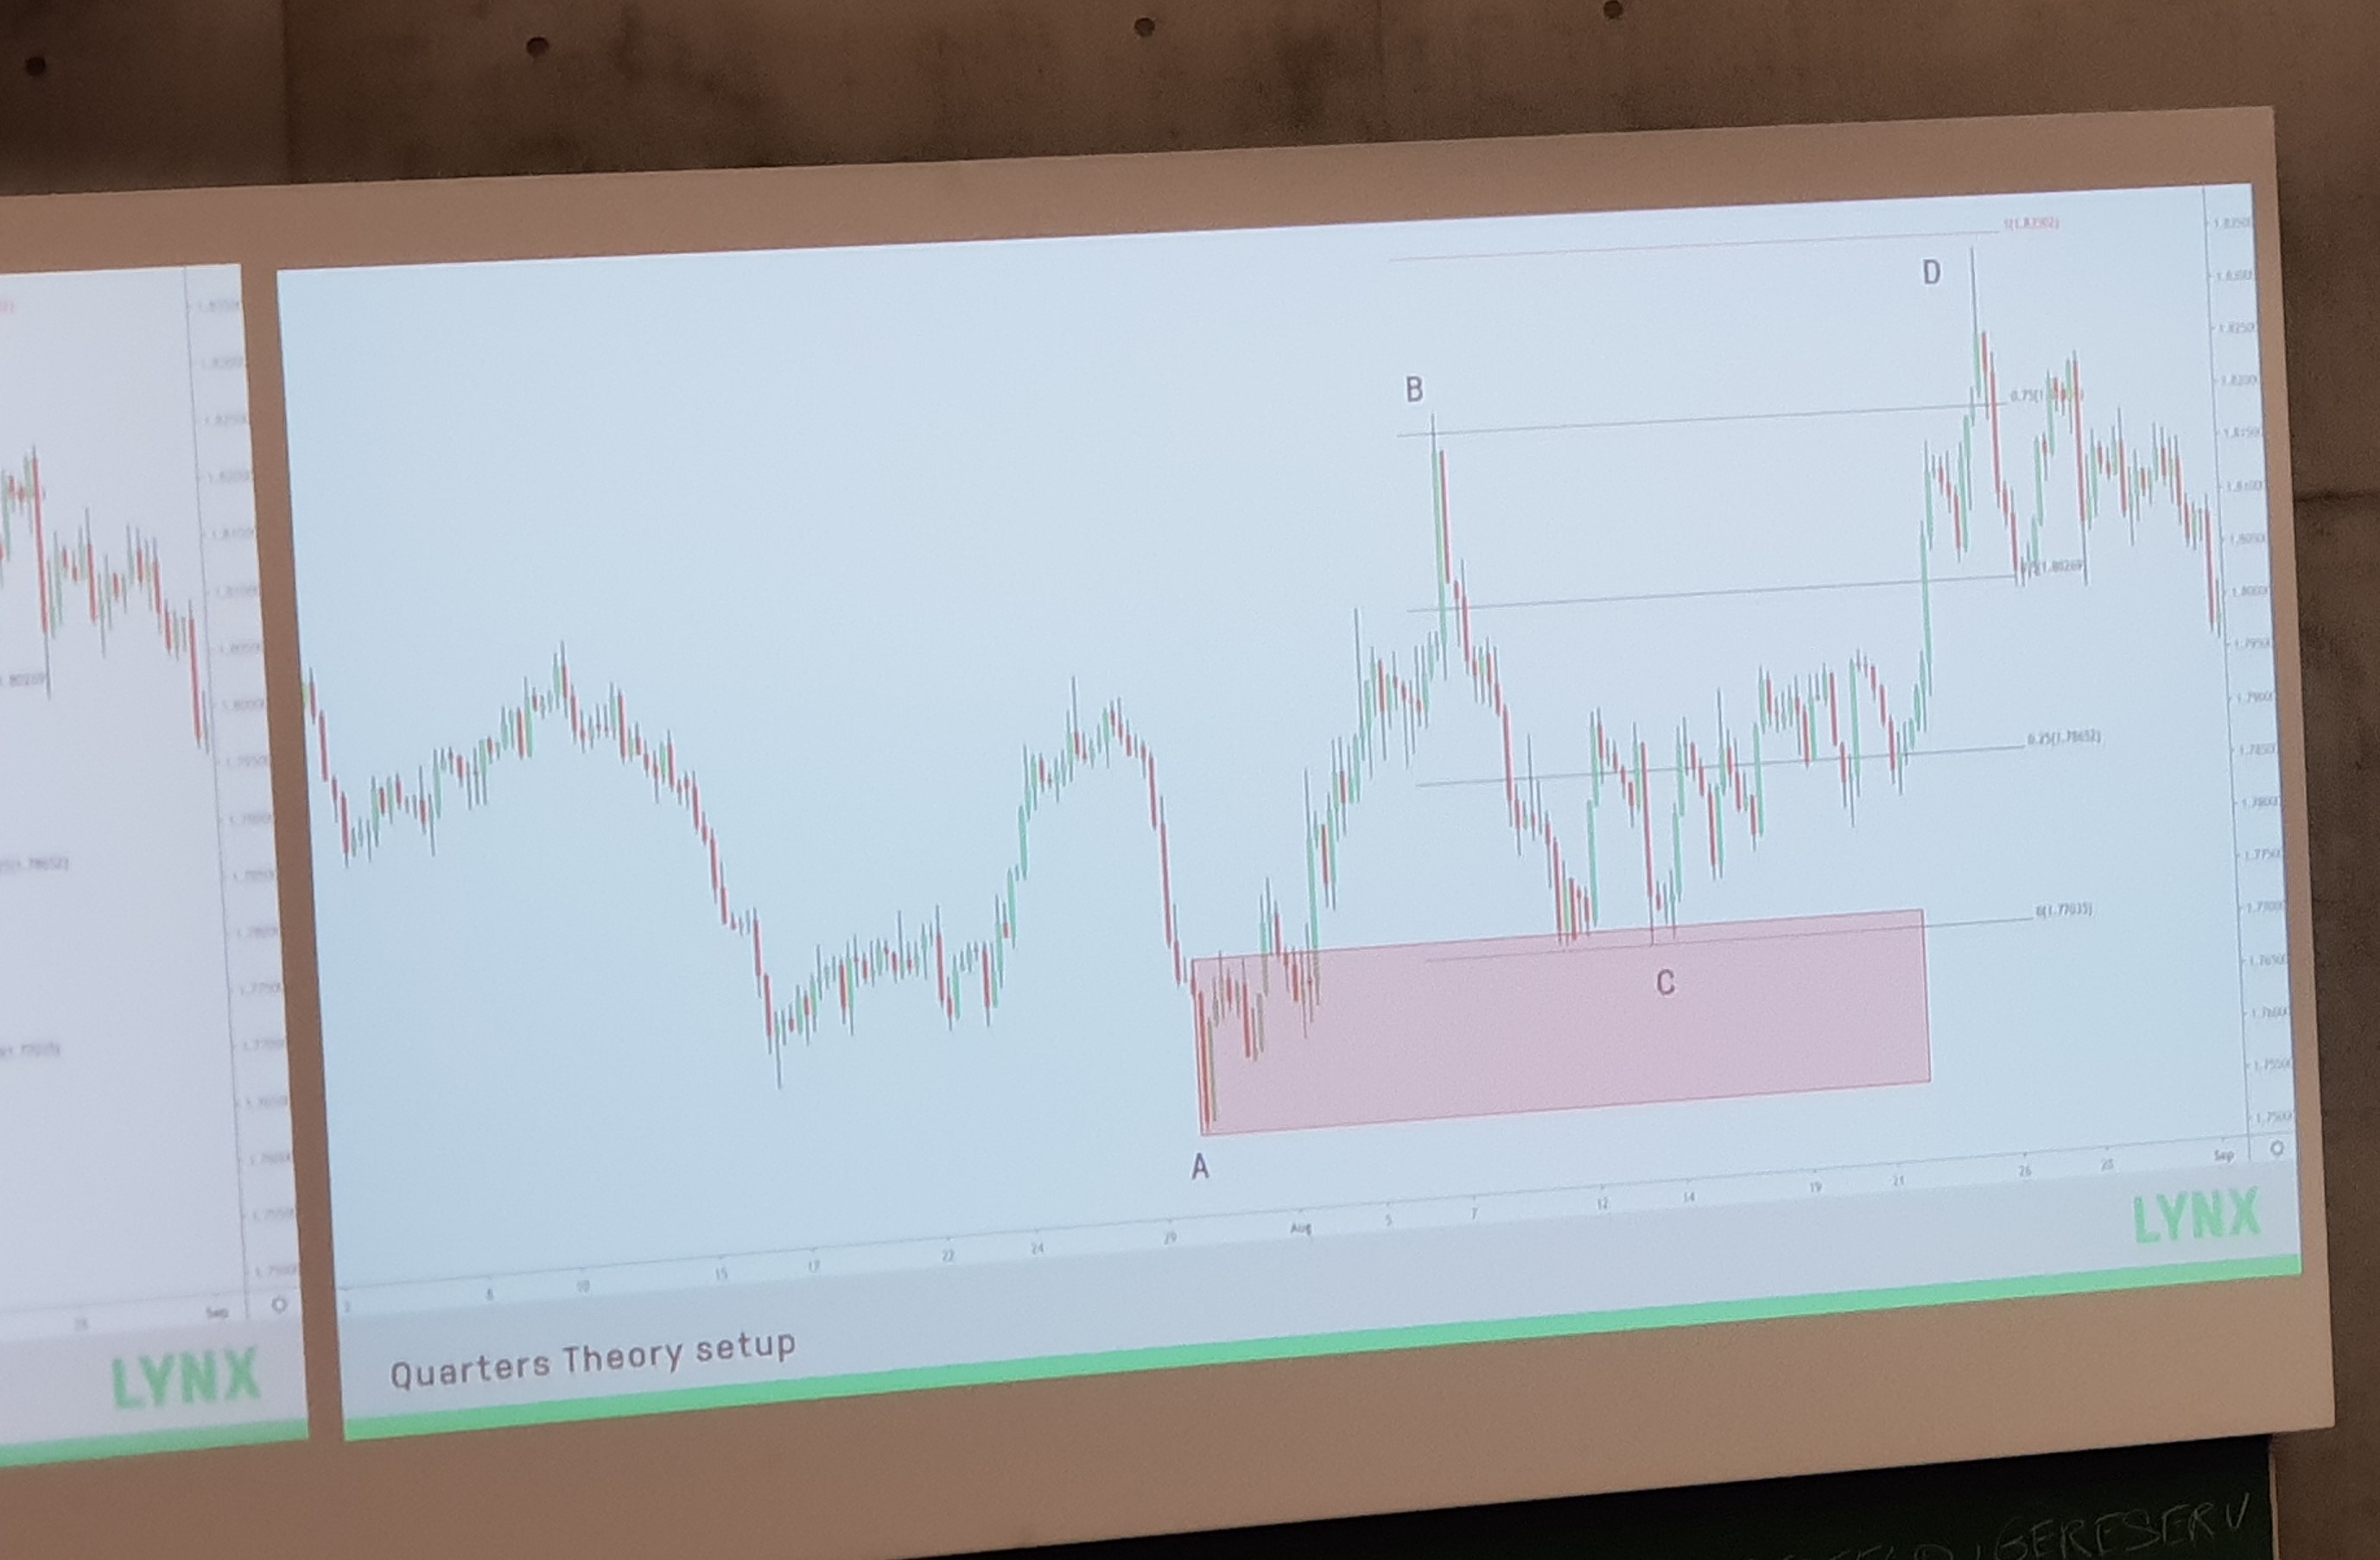
Remember of today The QUARTERS THEORY. Most people don’t have enough patience.
“A good trader can watch paint dry on the wall”
Quarters theory defines your entry, exit, stop losses and possible counter trend. Use the trend Fibonacci tool in the free charting tool Tradingview
Kevin explains the use of supply/demand zone together with Fibonacci to plan trades within an A-B-C-D pattern.
The Presenation : Kevin Verstraete en Ruben Pover
Never doubt AGAIN by Edward Loef
Can we predict the markets ? Edward asks the public who’s buying or who’s selling ? Making decisions in risky markets is not knowing what you are doing. Edward shows what’s the definition for gambling.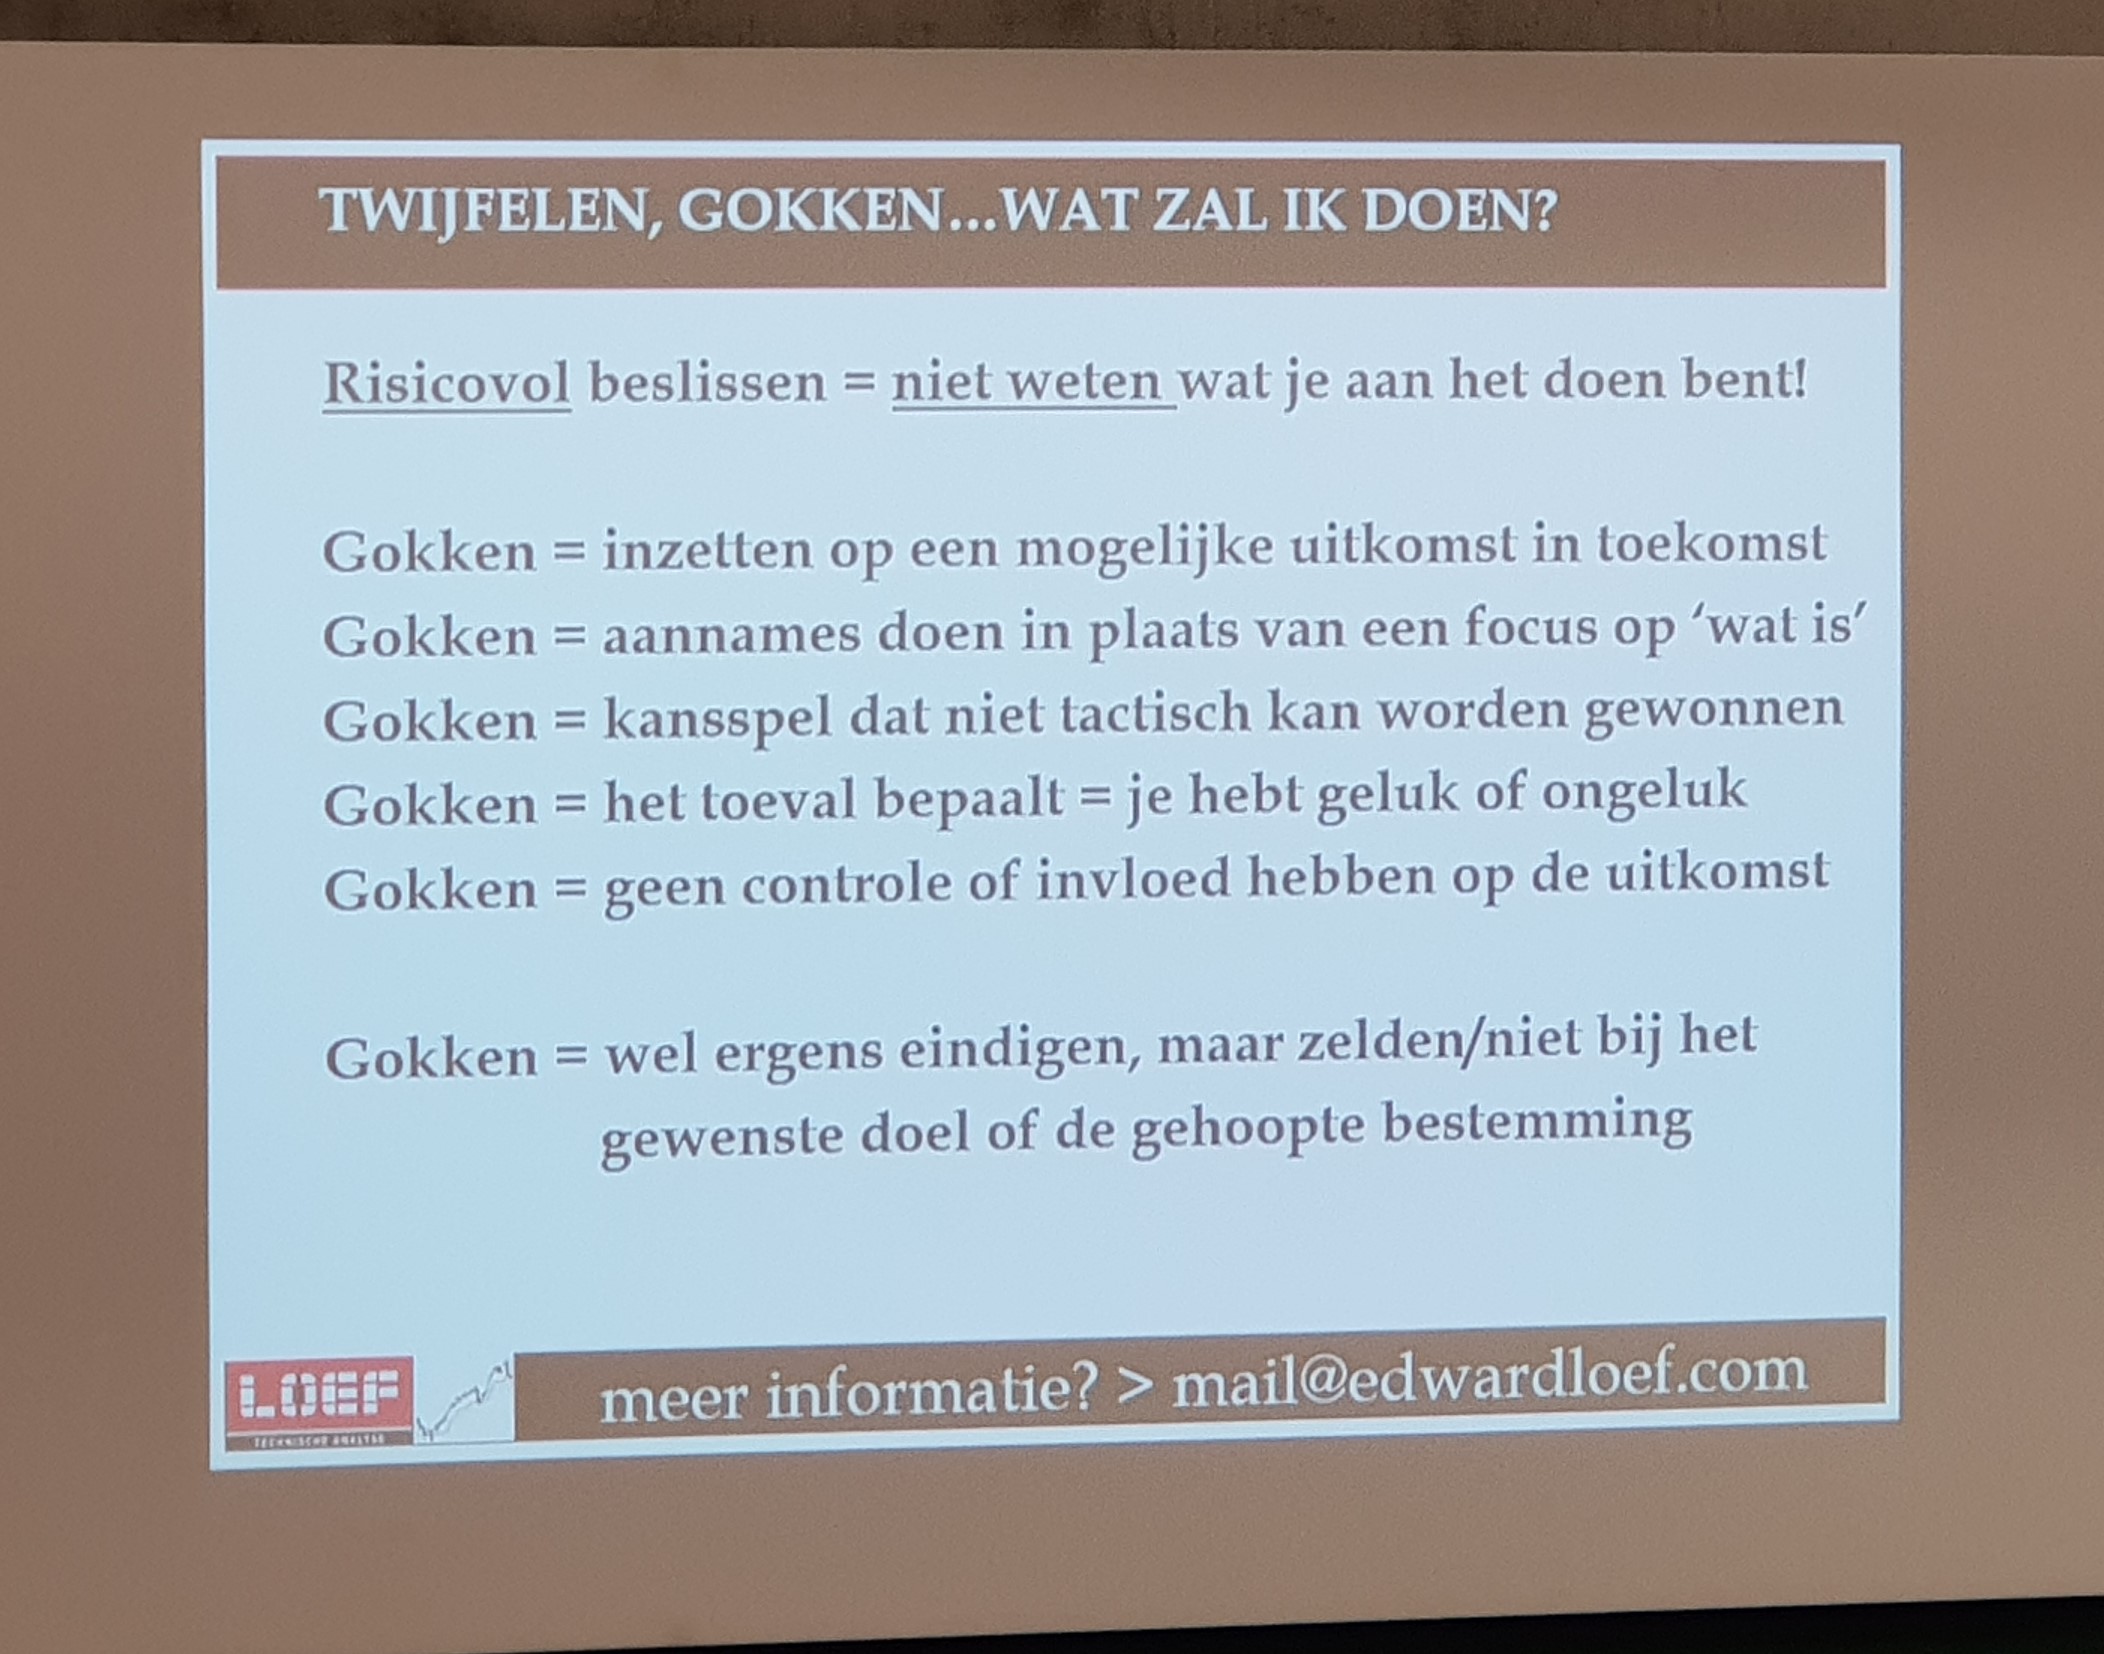
Here’s the RIGHT PROCESS for EXECUTION :
1. What is your motivation for actively earning money ? What’s your motivation?
2. When ? Do you want to free up time for it ?
3. How ? Which markets and instruments you want to use.
4. How much? What is your risk levels ? What is the risk/reward?
5. Exit ? Do you have an exit strategy?
Let’s take a look at the S&P500 INDEX on monthly basis. Candle sticks give us the light.
When the week is finished, you can review your execution plan during the weekend. You can use indicators such as MACD to make decisions.
The daily chart gives you quickly information. What’s your investment or trading horizon ? For each time frame, there’s a solution. You do not need to predict. You just watch what is happening. The trend MACD is still declining, so is it wise to invest against the trend ?
Let’s take a look at RATE OF CHANGE ? When we review the rate of change due to the economy fears over the virus impact, you have to ignore the media and learn from the past. When we look at the weekly charts of 2008, we identify a LOW and the markets moved back up.
RSI on weekly basis gives you an indication on when to sell or buy. Also on hourly basis, this is interesting to review. Bollinger bands and RSI shows you the bottoms. You don’t doubt then anymore.
DMI : directional move indicator shows the strength of the TREND. When the red line is above the green line, there’s selling pressure. Edward shows practical tips for executing a plan by using the following technical indicators. See slide.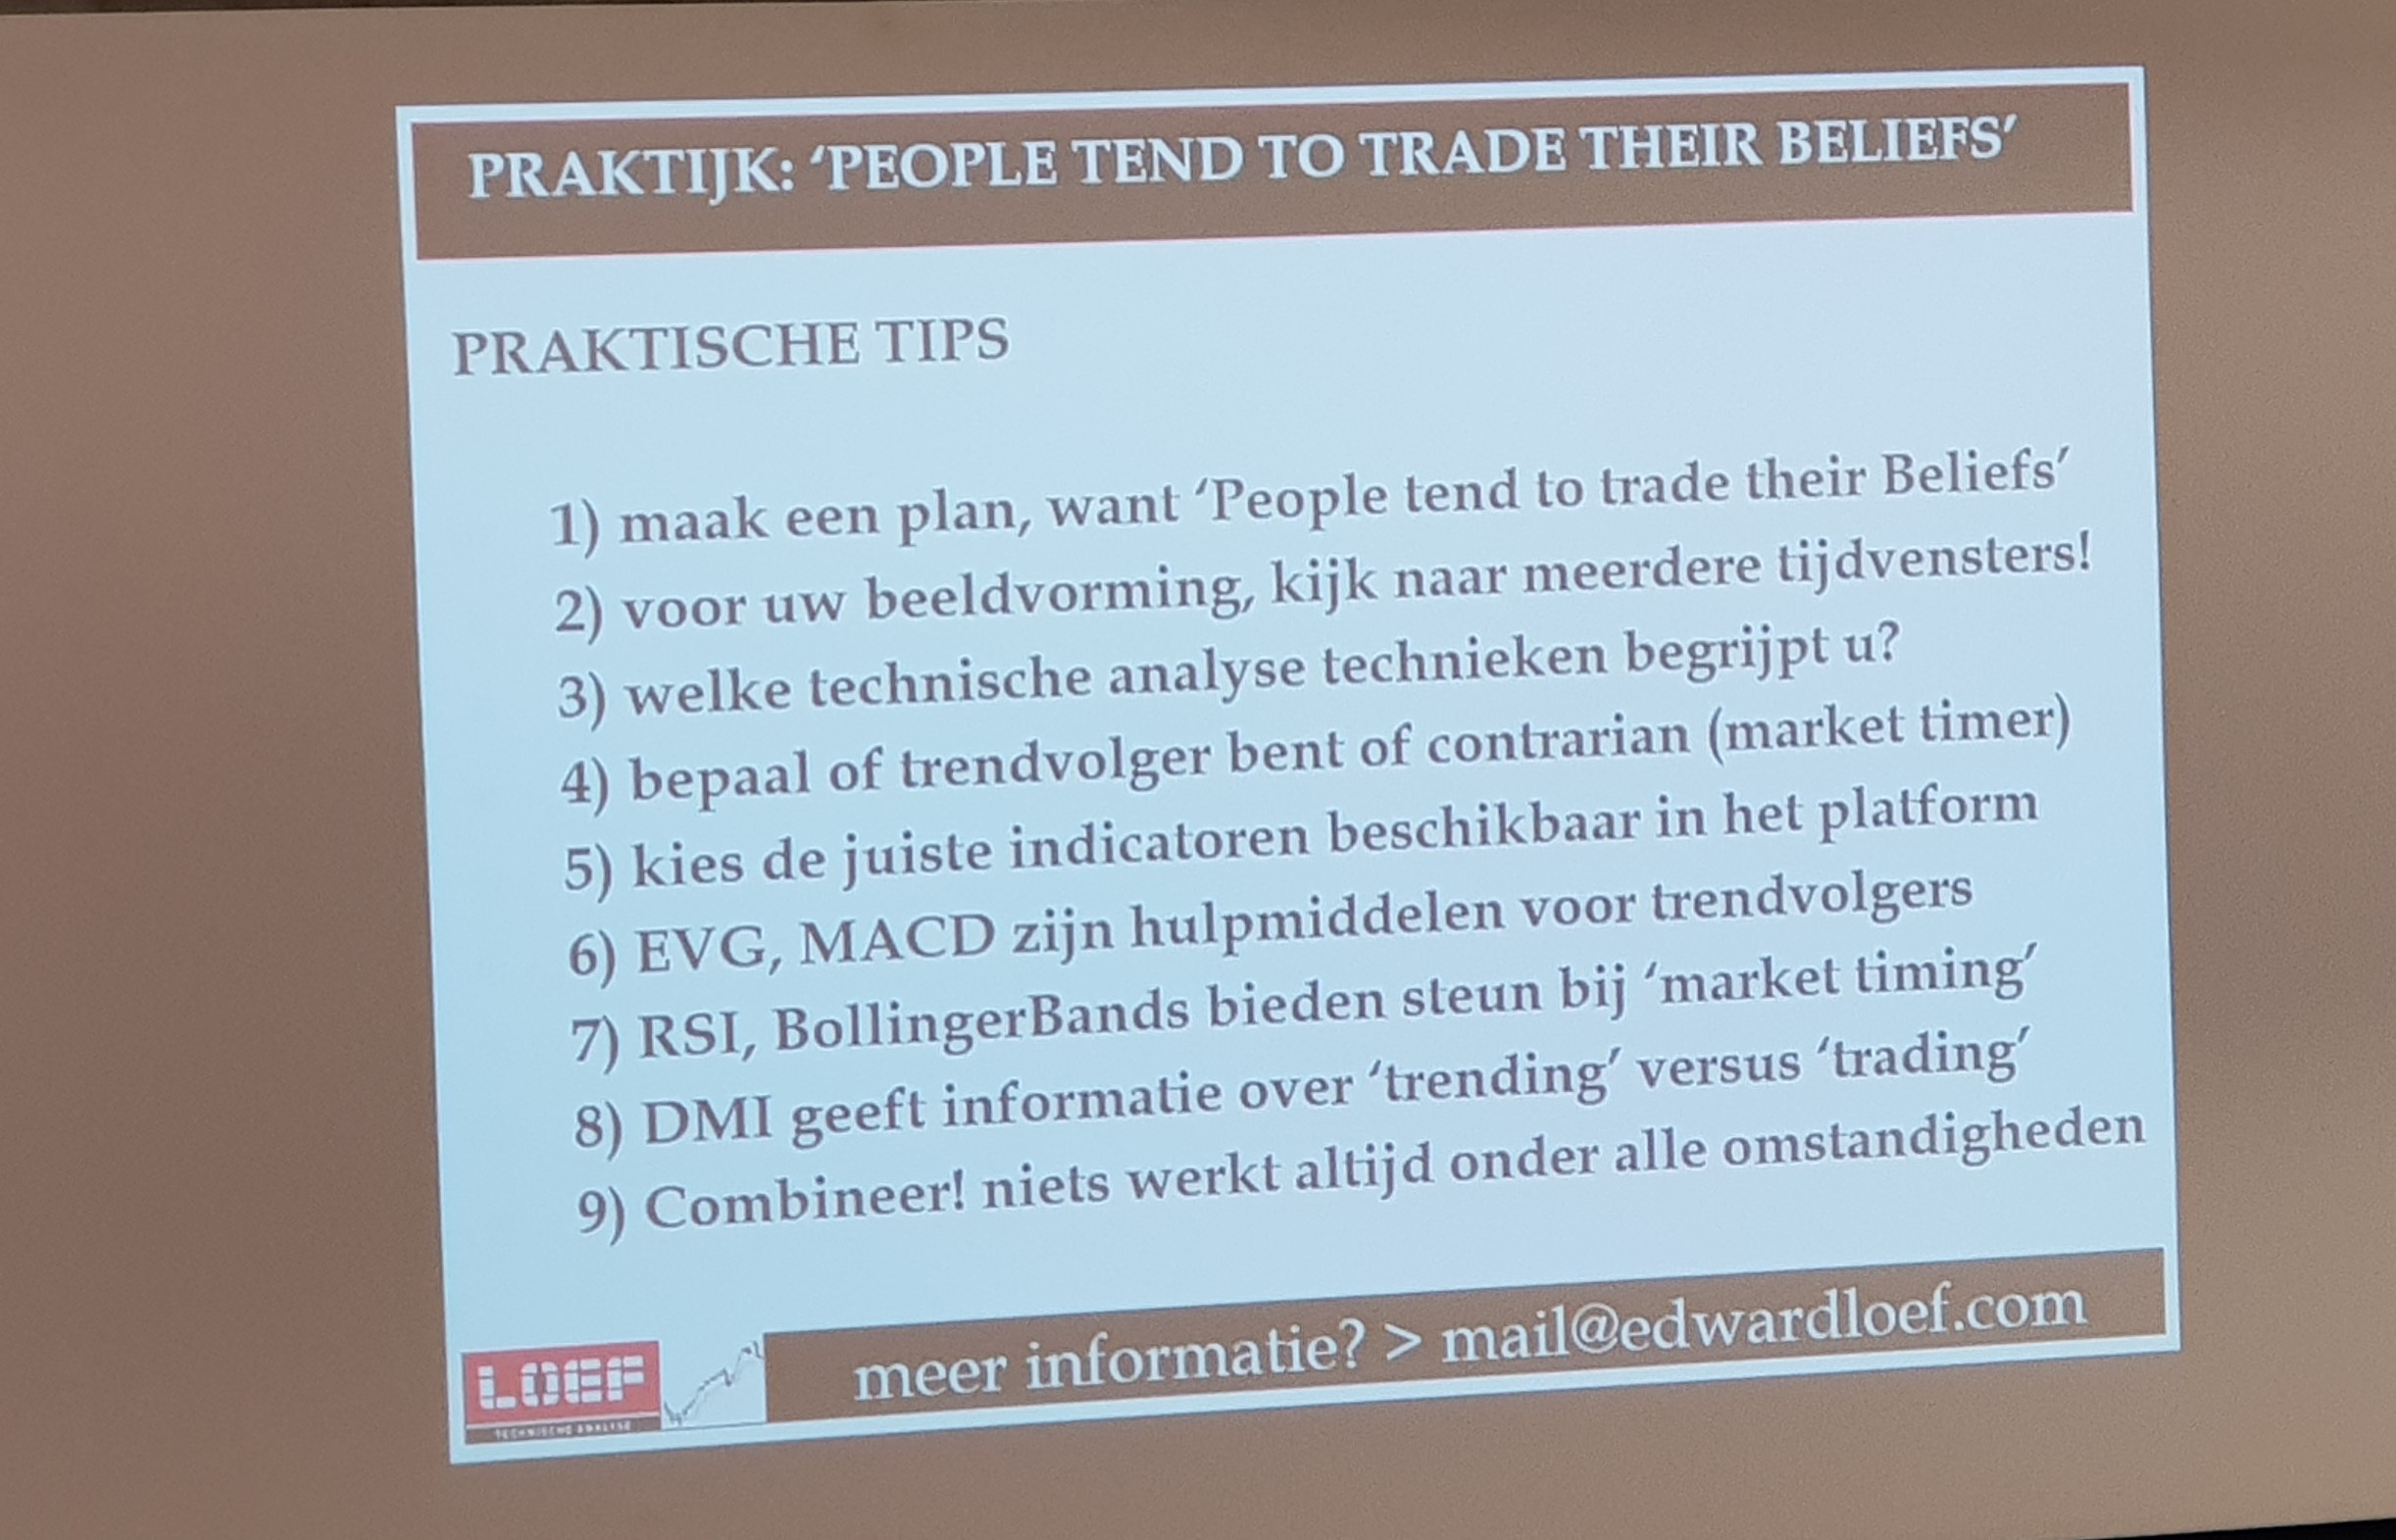
The Presentation : The Options Academy by Harry Klip
Options Academy by Harry Klip (Mexem – OptieAcademy)
Daytrading – Not for a DAY. Harry Klip was a futures trader and switched to trading options. Big banks always say “options are dangerous” but within Options Academy, Harry offers different options strategies.
What’s the difference between Day trading versus Investing. The difference is “Time in the market of timing the market“.
If you treat day trading as a hobby, it will pay you as a hobby. Treat it like a business. How longer the time frame, the more risk there is. The shorter the time frame, the less uncertainty due to stop loss. Many traders have no financial goal. A goal gives us a direction. You should only be in the market when all conditions are met.
You wait until you catch a fish, a big one or a small one. What’s a LOSERS MIND and emotions ? Fear, greed, too much confidence, stuck in a tunnel vision, uncertainty with no risk/ reward plan, results. If you fail to plan…you plan to fail !! What’s your trading plan ? Harry is a trader, not an investor. He takes every day a step back.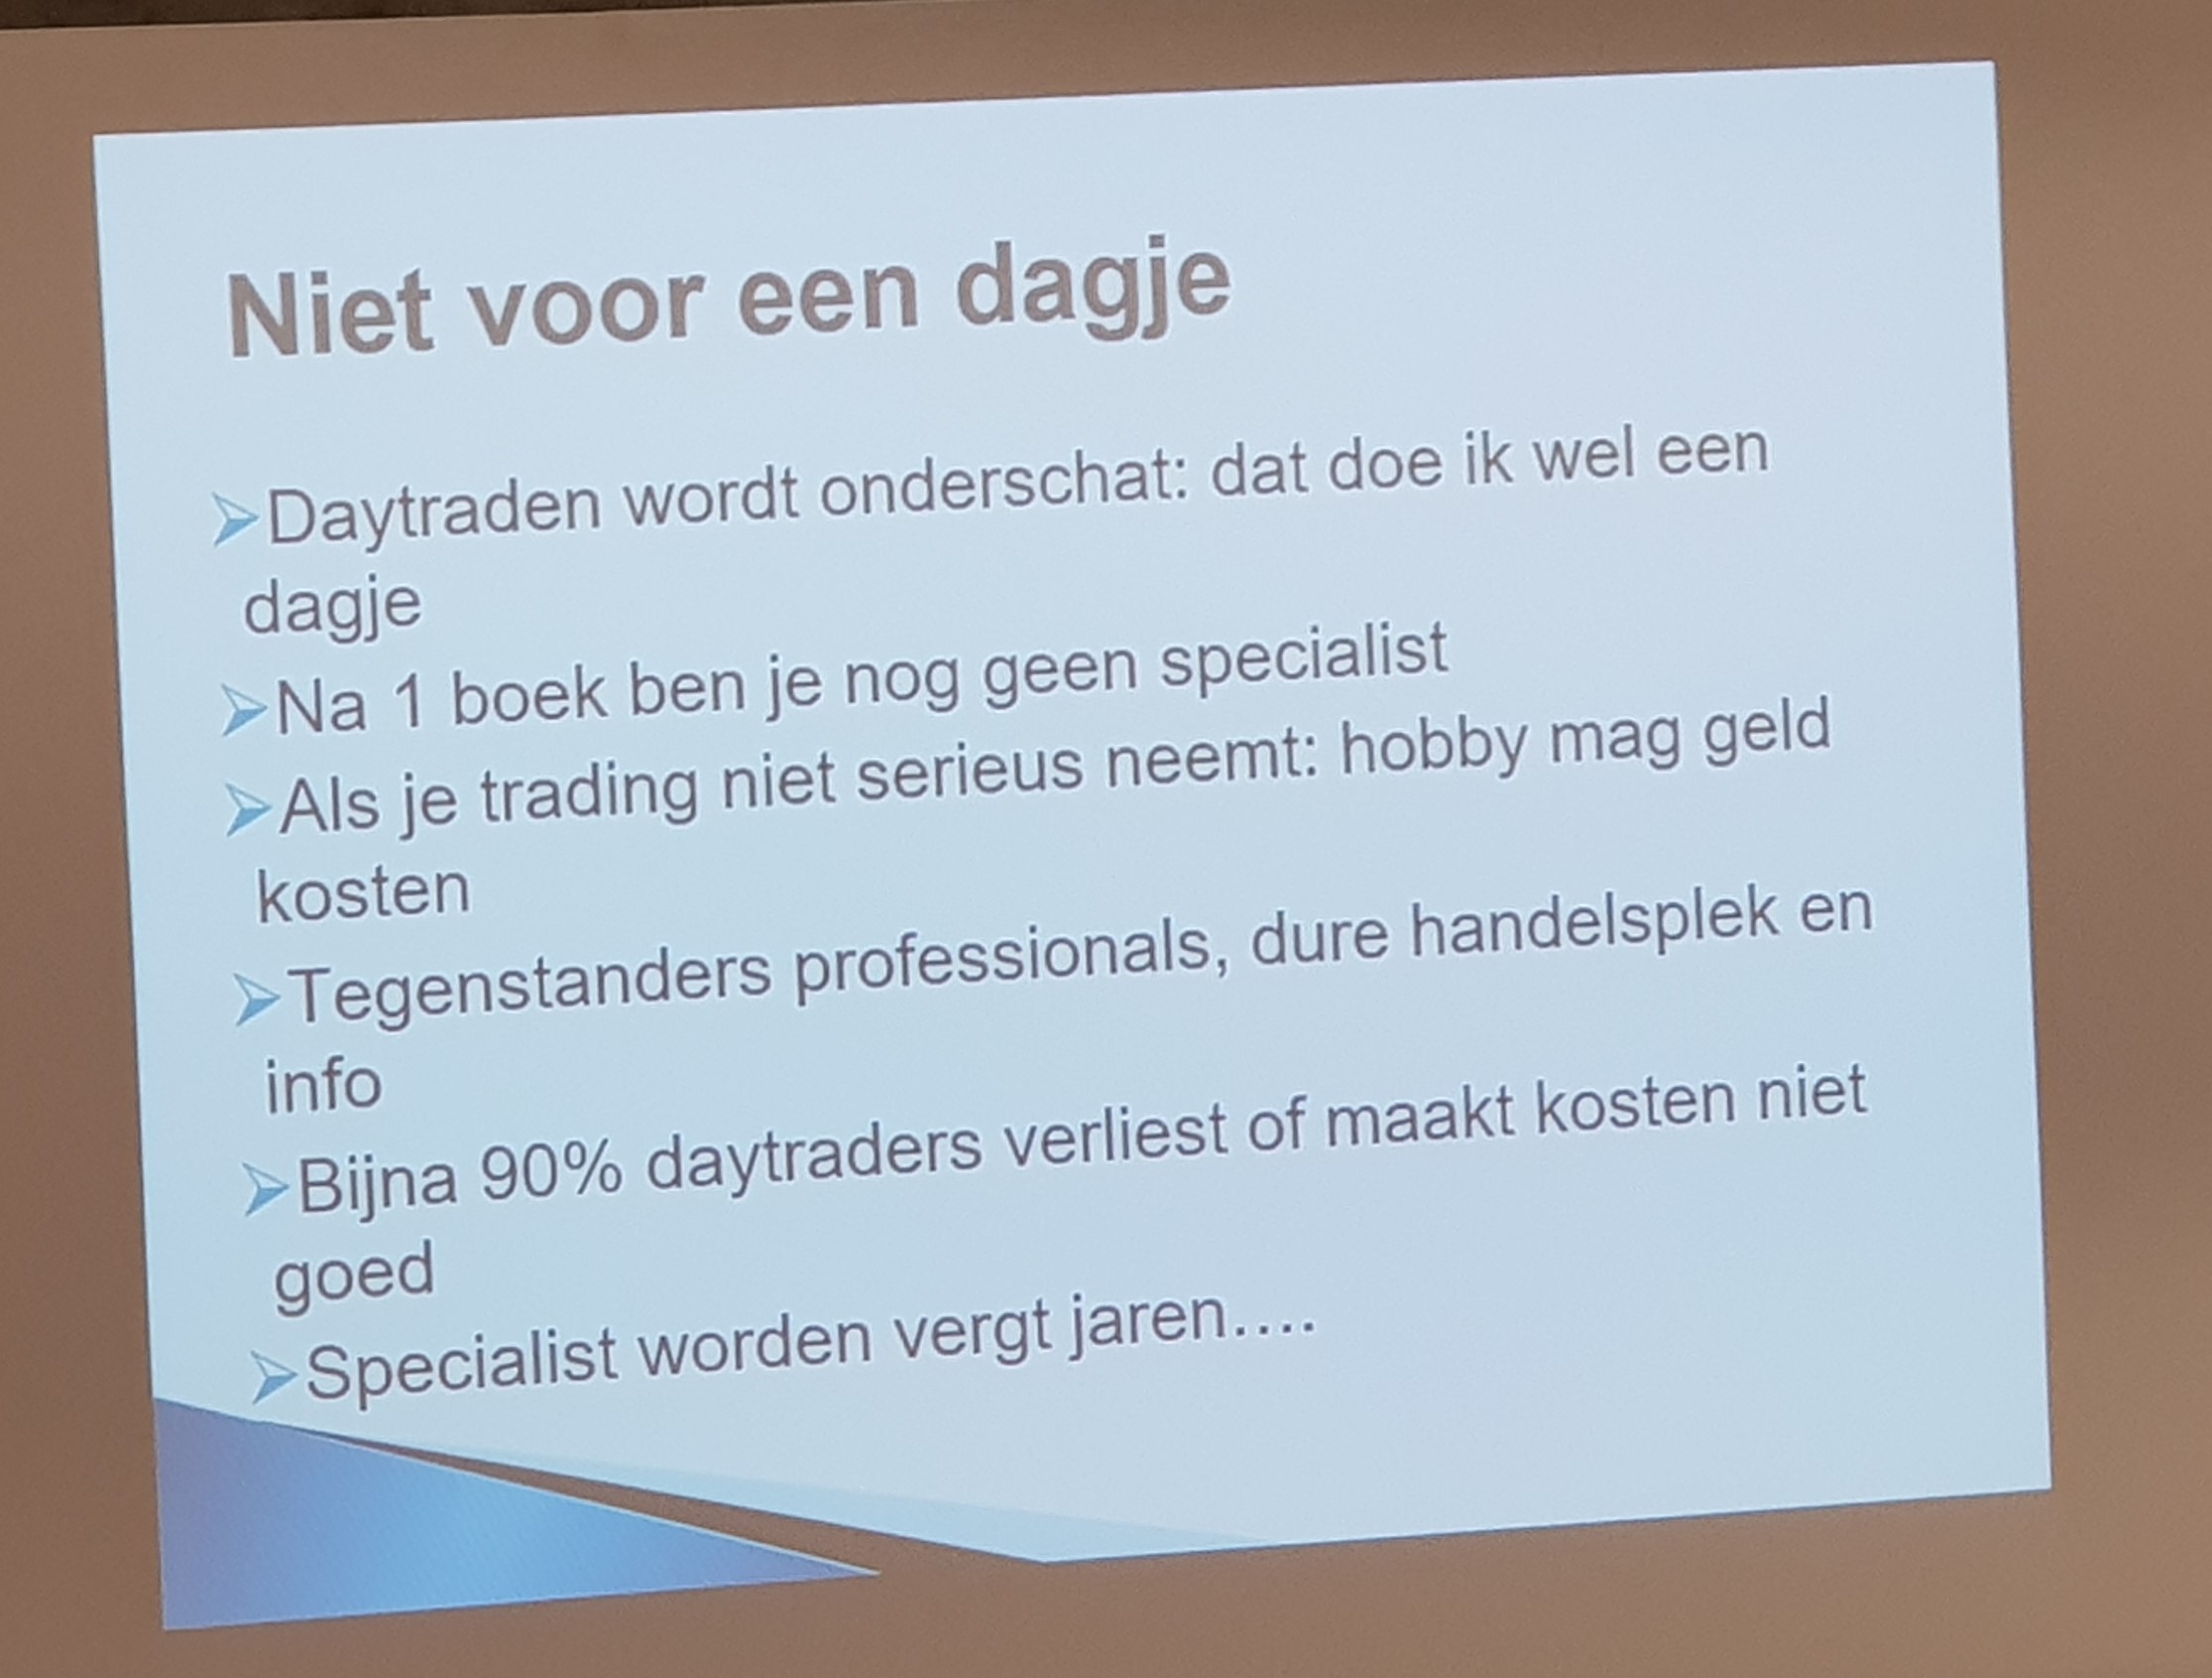
It’s about 4 M’s (Method, Time frame, strategy, and IN/OUT Rules)
- Method – Strategy
- Mindset
- Money Management
- Mentor to review your negative days.
Day trading is underestimated. After 1 book, you are not a specialist. If you don’t take trading serious, you will get burned. The market is always RIGHT ! As day trader, you just follow the wave. Create the right winning mindset. Accept losses. EGO means “even geen omzet” which means in English “temporarily no income”. Always think 2 steps ahead.
CryptoAcademy by Jan Robert Schutte
What are cryptocurrencies ? Digital money with Bitcoin as biggest example. The advantage is there are no banks needed.
There are also disadvantages as you are your own banker. You need to safeguard your own keys. It’s not user friendly and there’s high volatility. Also hackers steal bitcoins from unsafe exchanges or portfolios.
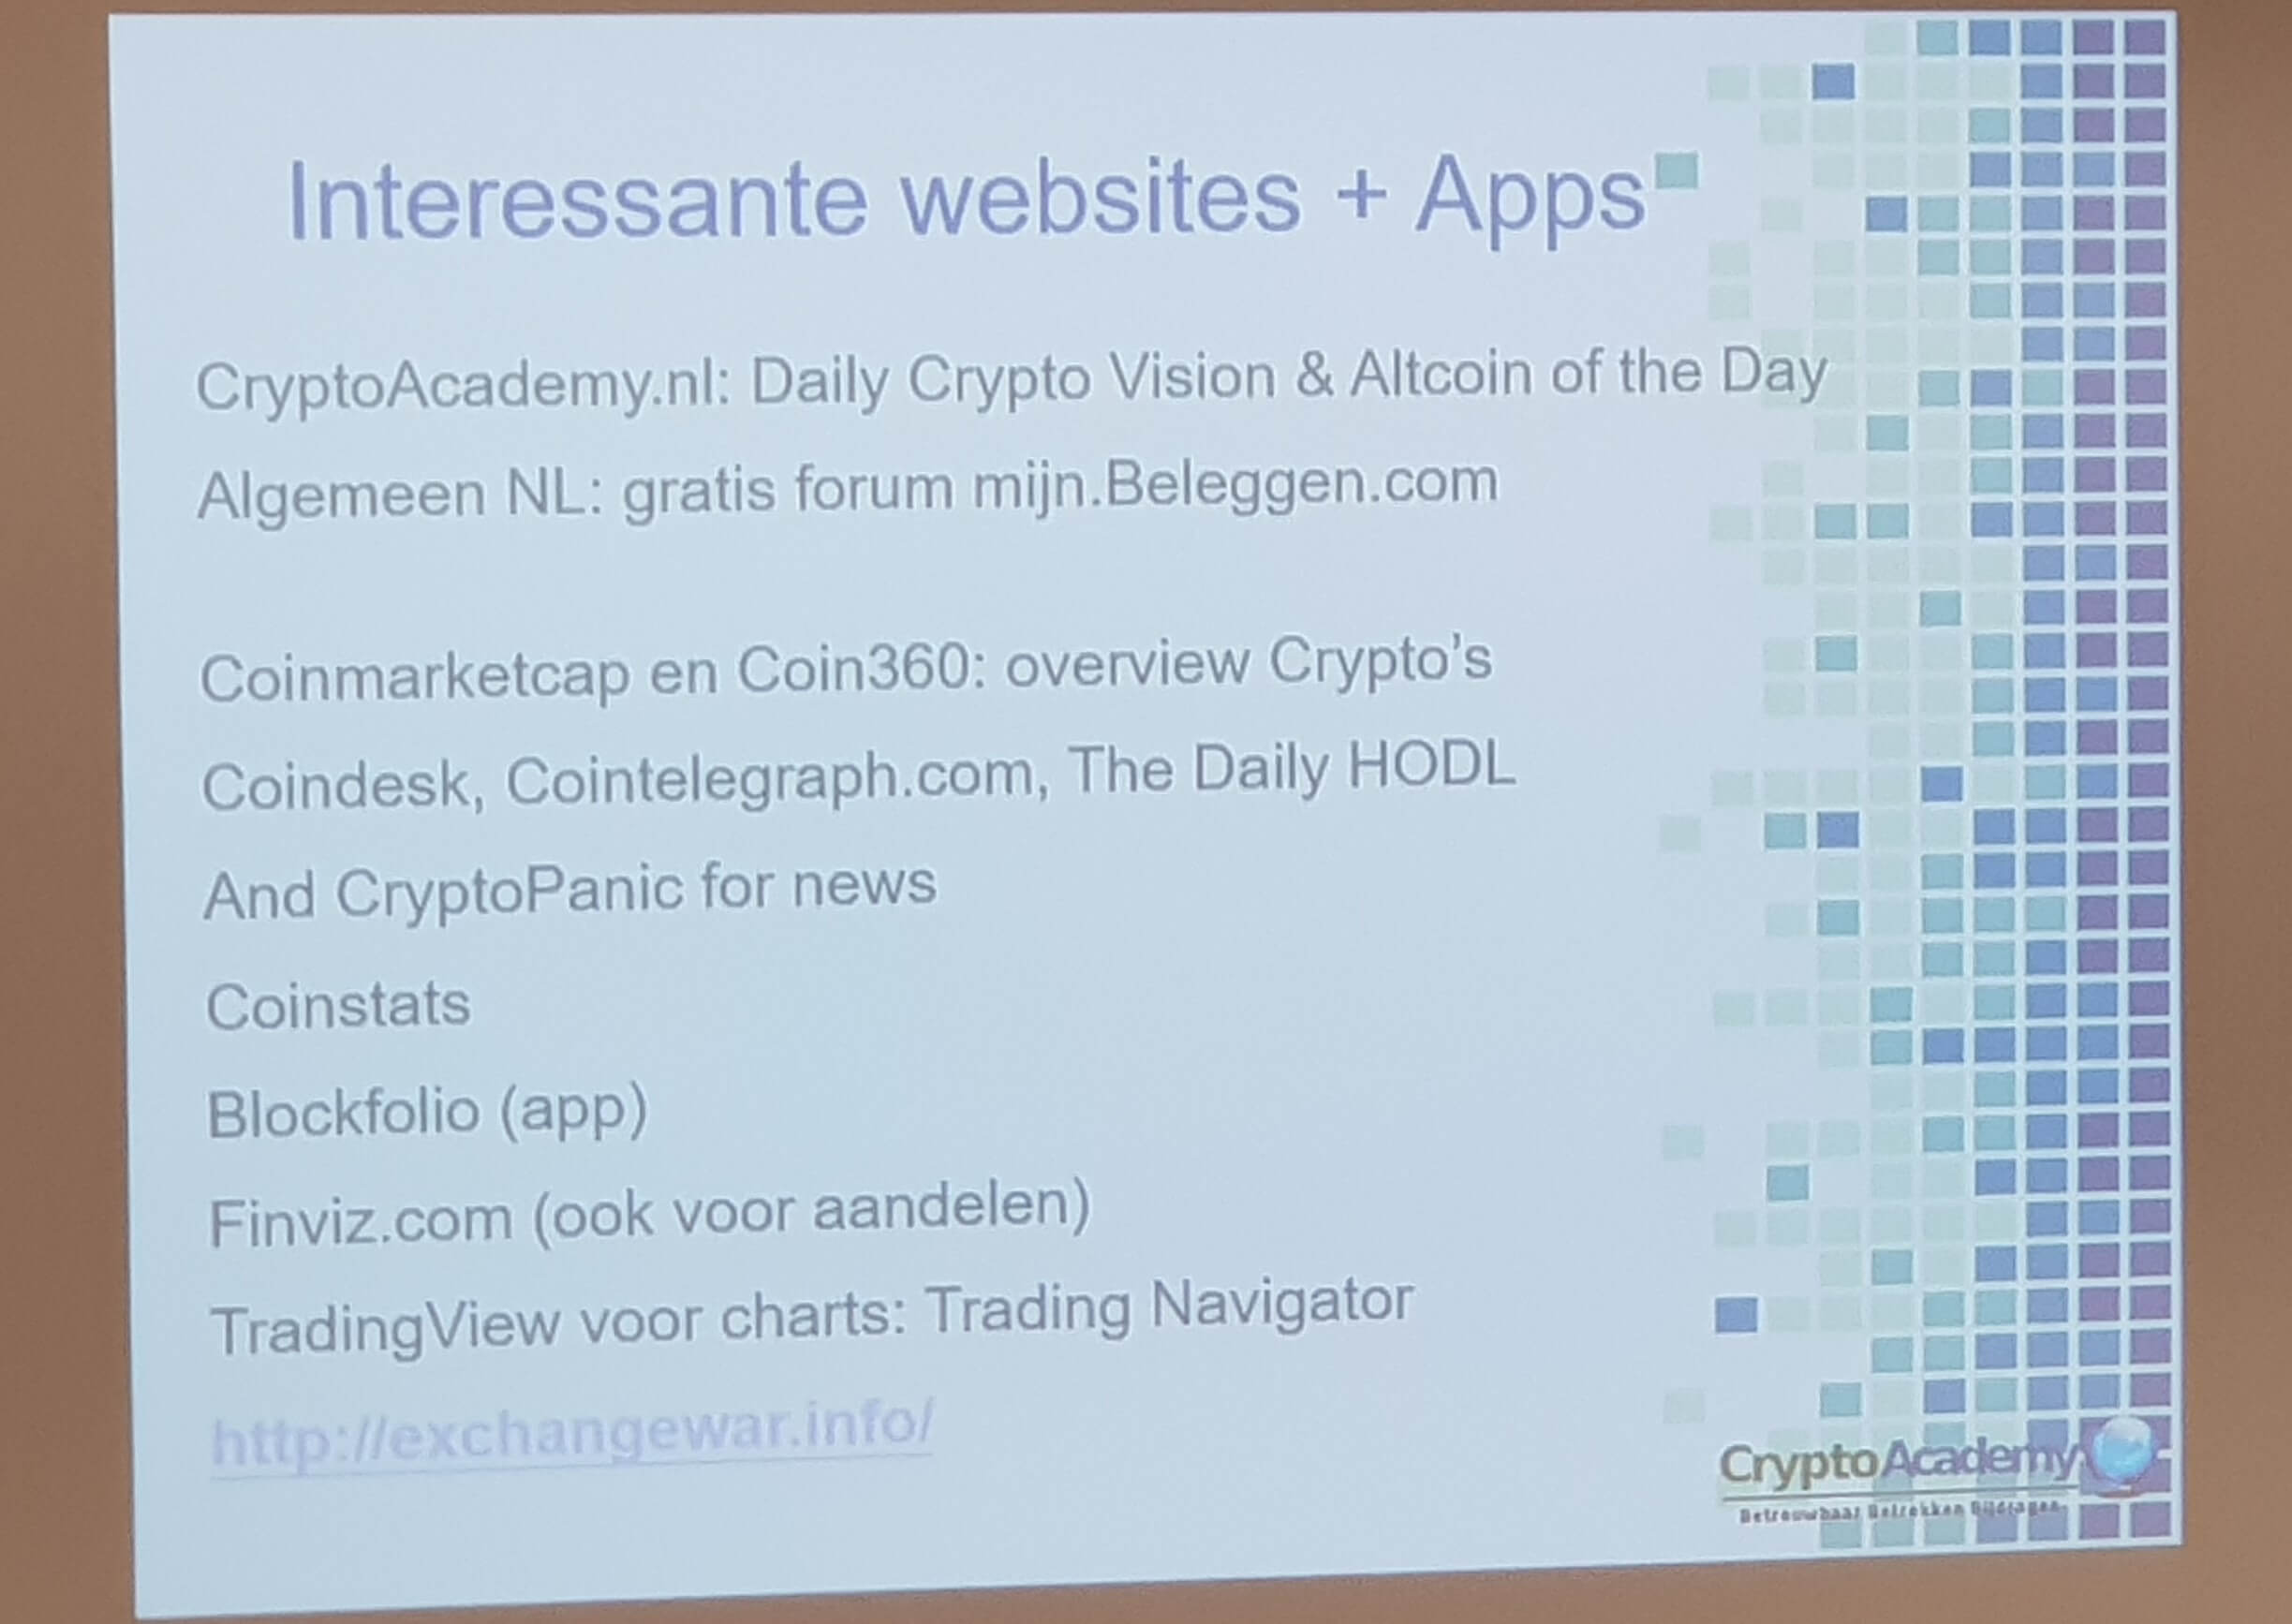
You can find more information on below websites. Coinflex is a website where you can trade with leveraged futures. They also have trading competitions. Every week invest 50 to 100 euro if you want to build up a cryptocurrency portfolio. If you trade, always trade in the direction of the trend.
You can also purchase 5 or 6 Cryptos ETF of AMUN. Jan Robert reviews the charts of all the different cryptos.
The Presentation : Crypto Academy by Jan Robert Schutte
Back testing of a Technical analysis strategy by Dirk Arens
If you want to bake a cake, you need a recipe. But the proof is in the eating. You also need the right proportions and the technique to get to this final result.
So you need a business plan and plan of execution. Back testing allows to validate your strategies and doesn’t impact your emotions. It’s just data.
Technical analysis is just a TIMING tool. You can use indicators. Once you receive your data, you can do your analysis and execute your trade.
After the back testing, you can enter with proper risk management and a defined stop loss. You need to apply statistical reasoning for defining your stop loss. Losses can not be avoided. The next step is correct position sizing and apply proper money management.
Dirk uses for example ATR (Average True Range) indicator and other indicators to execute the back testing based on past data. Then you evaluate the results. How many losers and winners do I have ? What’s the maximum draw down ? You can always adjust your plan if needed.
The Presentation : Back testing by Dirk Arens
Hunting Cheap Momentum Stocks By Ronald Kok
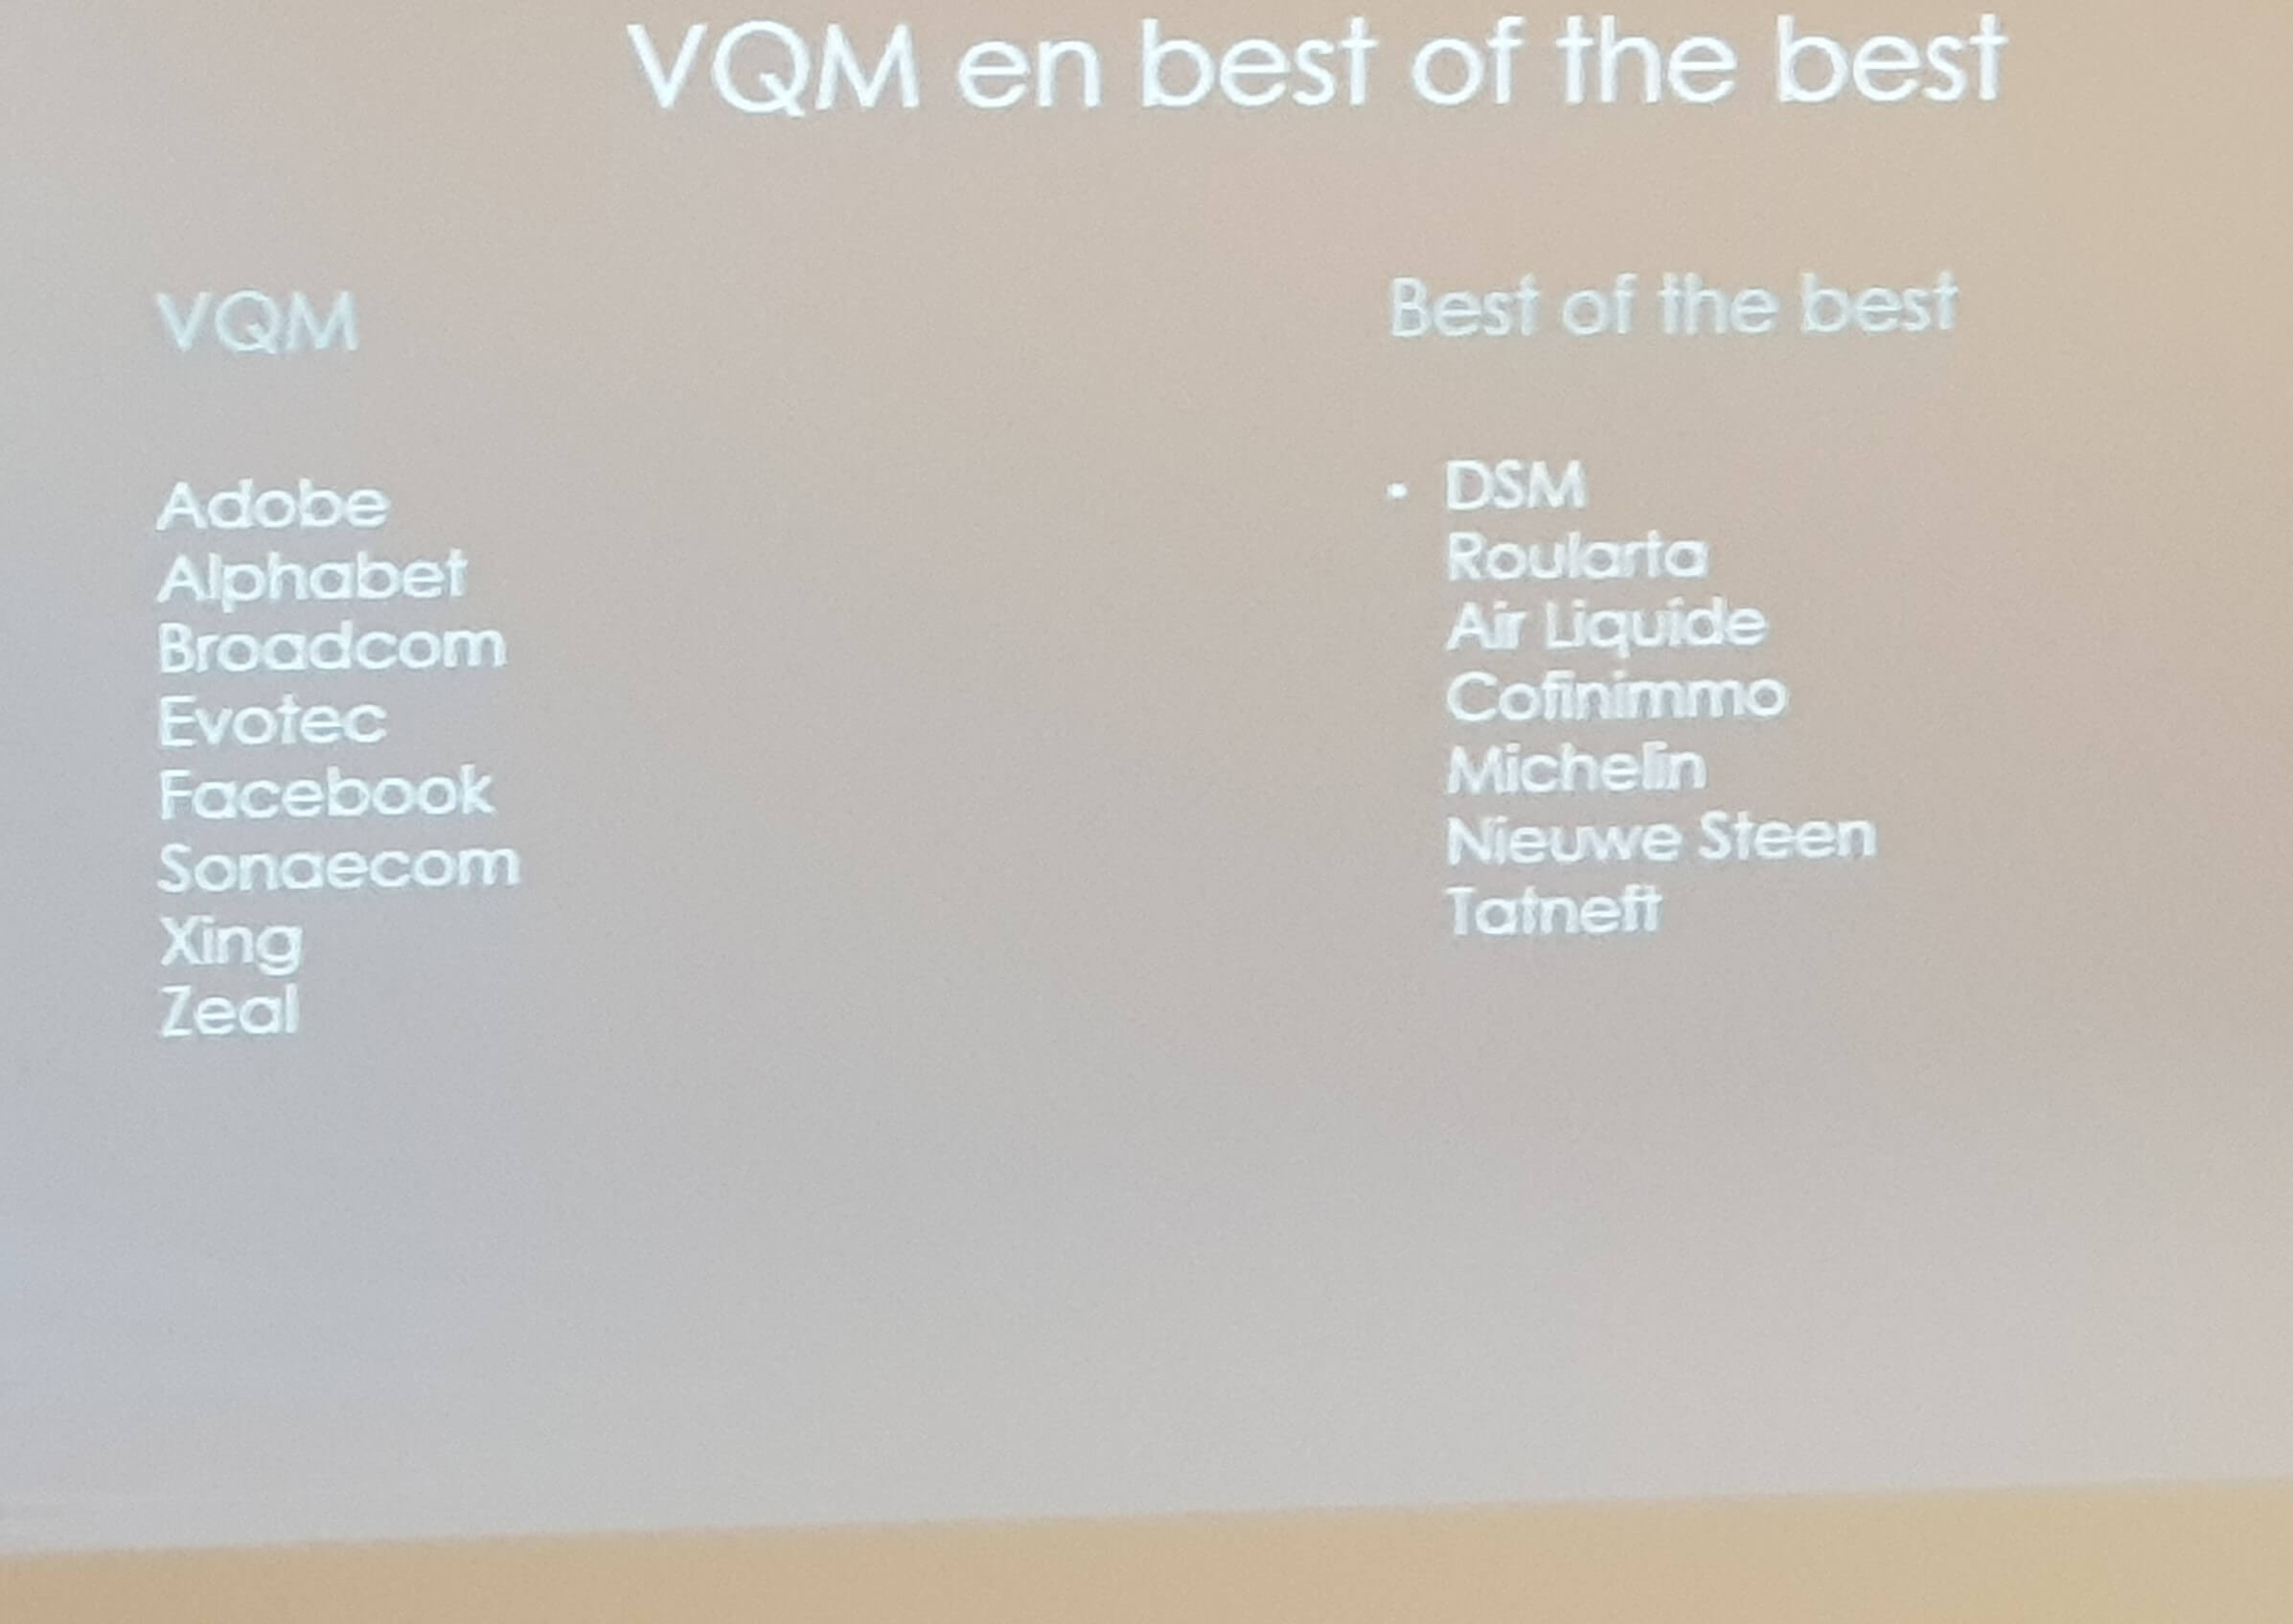
Let’s search for “safe” stocks who can offer value, quality or do have momentum. Ronald used a screener to make a selection.
He created two portfolio. Value, Quality & Momentum portfolio and the Best of the Best portfolio. You can see the names in the screenshot. The VQM portfolio allows only stocks with a P/E of 5/10 with a dividend higher than 2%> There are more criteria which Ronald applies. This leads to this following stock selection.
The Presentation : Stock Selection by Ronald Kok
Stocks Review By Wilfried Voorspoels
Wilfried analyses for the public around 10 stocks based on Technical Analysis. Stocks that are declining, stay away. Stocks that have bottomed out, you should buy. Air Liquide is in upward trend channel. Wilfried uses the MACD, DMI and full STOCH indicators to review the stock chart. See the presentation. Most stocks showing negative signals.
The Presentation : Stocks Review by Wilfried Voorspoels
Final Note
What did we learn ? The most important key learning for me was the strategy that Hamish applies with options. This was for me new as all the other presenters presented something I had already learned in the past through investing or trading courses. I will investigate the strategy applied within the Option Generator if this is something I want to apply.
Stay safe and healthy in the coming months as this corona pandemic won’t be over in the next 8 – 10 weeks. We hope you learned something from this blog post and you appreciate our effort to write up the summary. All the best for you and your family
Don’t hesitate to leave your comments and feedback. Let us know what you think.
Good luck with your personal finance strategy! Thanks for following us on Twitter and Facebook and reading this blog post. As always we end with a quote. A quote which was shared during the day. It means in English ” IF YOU DO WHAT YOU DID, YOU GET WHAT YOU RECEIVED BEFORE”.
No Comment
You can post first response comment.