
Do you know Tia Hellebaut ? She was a Belgian athlete who won a golden medal for Belgium in the Olympics in China. She did an amazing job high jumping more than 2m high… her hard work and focus on food, sports and her objectives always inspired me to work hard towards my own objectives. The October month we did set a new cash flow income record. Tia’s face expression was exactly my face expression after seeing my total income. Read more below how we achieved that.
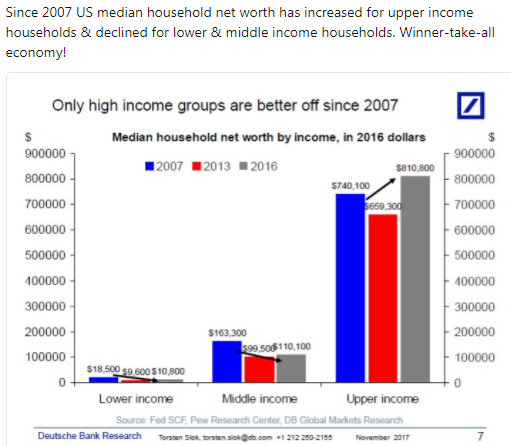
Recently an interesting tweet was shared with a graph about the net worth of US households. Since 2007 US median household net worth has increased for upper income households and declined for lower & middle class households. That doesn’t surprise me as during Bush’ presidency the middle class was almost wiped out. This is winner-take-all-economy and if you are in trouble, you better make sure you have a an emergency fund.
Do you calculate your net worth ? I do it once a year…always at the start of the year. How often do you revise your net worth ? I know bloggers who post a monthly update of their net worth growth .
So let’s go towards to our Market Analysis.
Market Analysis
When we analyse the performance of the SPY (screenshot 15 November) we can conclude that the bull market has been strong. During the past month we keep on breaking All Time Highs one day after the other…below you see some interesting facts
- The S&P 500 has not fallen by 3% to 5% for about a year, and could soon break its record for such a streak.
- But those kinds of pullbacks could resume next year, says Binky Chadha, Deutsche Bank’s chief strategist.
- He sees stocks resuming their rally after such a drop in 2018. The current rally’s length without a pullback is unusual relative to history, its speed and size are not.

Stocks are supposed to go up a lot and down by a lot. But lately, they’ve mostly been going up. The S&P 500 has not fallen by 3% to 5% for 12 months. The historical average is every 2 to 3 months on average, Deutsche Bank observed. If the current streak without a pullback that large continues for two more weeks, it would become the longest-such rally ever. “The duration of the equity rally without a typical 3-5% pullback has been very unusual, and the rally is on track to become the longest since WWII,” said Binky Chadha, Deutsche Bank’s chief strategist, in a recent note.
He explained some of the driving factors behind this atypical moment in the stock market, while forecasting that the longer-term bull market is not ending anytime soon. Earnings per share for S&P 500 companies should rise 11% in 2018 to $146 from $131 this year, Chadha forecast. Share buybacks continue to be a strong source of support for stocks even though they have shrunk as a share of market cap. Traders are betting less on stock-market drops overall, although single-stock short interest has increased slightly, Chadha wrote. When I follow the behavior of Belgian investors within FB groups, I see the same investors’ buying pattern behavior…buying at the dip,they say….

Did you see the nice green arrow that I drew last month ? Did you see how the SPY followed nicely my line ? We did not break that 260 level and in the next days or month however stocks could get slammed down as details of the Senate tax plan come out, and huge after hours earnings await. Also profit taking after this strong rally will occur. We see the first profit taking today and maybe in coming weeks. I did draw three arrows this time and I see three possible scenarios.
- Scenario 1 : Correction Down. We take a breather pullback to 254 or lower and then flush through that 254 level back down to 250. Similar move as Japan NIKKEI index past days …
- Scenario 2 : Consolidation phase. We go sideways between 254 and 260 before deciding direction in next month
- Scenario 3 : We pull back a litte this week before breaking that 260 level and go higher according to trendline.
I can not predict the markets but last month I was spot on ! I think sentiment is turning more cautious amongst investors. We will review sentiment in our Sector Watch blogpost within 2 weeks.
![]()
Let’s dive in the numbers of my October Dividend Income Report.
Options Income & Dividends received in October 2017

Did you see that we changed the title of the section ? Yes, we earned our first Options Income money !! A total of 537$, not bad, he ? We sold 5 covered calls and the options expired worthless. Tax free money in the pocket ! In addition we received our Dividend Income from our monthly and quarterly paying stocks and ETFs.
Do you know the salary of a teacher French in Belgium ? She earns 3052 euro gross which equals 1.899 euro net. Let’s compare that against our total dividend and options income.
In the month of October 2017 we received the TOTAL of 2284,13$. Another NEW RECORD MONTH ! Definitely a solid month above 300$, our 2017 yearly objective. This is the 4th time this year we set a new RECORD HIGH INCOME. This equals 1928 euro which is more than salary of the French teacher…Let this result be a motivation for you to learn how to invest in the stock market and get you a second salary. Yes, I know I also lost money in August but learning from your mistakes is part of the game. Sometimes you win, sometimes you lose. Keep the losses small while adding up the winners is the game !
Below you see the monthly summary overview of the cash flow coming into my bank account…we received a total of 1337,70$ from quarterly paying ETFs and 409,43 from monthly paying stocks and ETFs from the monthly total.
![]()
Portfolio Analysis and Growth
No unpleasant surprises in our portfolio. We did sell one of our bigger positions in the ETF BDCL. This Business Development Companies ETF was suffering from some bad results within the BDC sector. Did you see the dive of PSEC to 5,60$ ? I did write in previous blogposts that this stock would go to 5 or 6$. I am glad I took my profit long time ago.
We had this ETF in our portfolio for several years but it did came close to our purchase level with the spike around 15,50. It has been a nice ride and we may step in again at 13,5 or 11$ level. Our portfolio is now 25% cash.
![]()
We will need to find another passive income source to replace the above BIG payouts of BDCL.
The Euro/Dollar trend
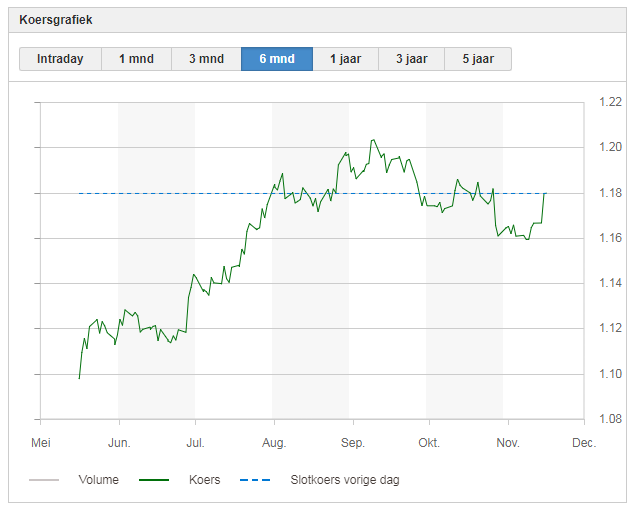
We keep on following the EURO/USD valuation. The EURO dropped to 1,16 level . We expected the 1,155 level to break but the economic figures of Germany were very good and EURO rallied back above 1,175. Market watchers expect the EURO to rally further…
A strong EURO is not good for European export companies. We don’t worry as we receive all our cash flow in USD. No currency exposure as we do not intend to transfer in EURO. We just build our cash flow income stream in Dollars.
Going forward
It is definitely a great feeling to receive another monthly income above 2000 $. It feels like a second salary. How are we doing on our journey towards our 2017 Objective?
We did a SMART objective of 6600$ for 2017 and we did break our yearly objective again.
We did wipe away our august loss and focus still on options investing. We now exceeded our yearly goal with 31% and have a yearly total of 8656,30$. Great !
Below you can see the detail summary table of our monthly payouts including losses and the new row Options Income.
![]()
Two more months to go to finish the year. Let’s focus on getting those months above 300$ as well. That would bring us above 9000$. Then I can reflect back on a great year.
What do you think about our monthly performance ? Don’t hesitate to leave your comments and feedback. Let us know what you think.
Good luck with your personal finance strategy! As usual we end with a quote.
Sources : Yahoo Finance
No Comment
You can post first response comment.