
Financial education is IMPORTANT!
If you read my biography in About me, you know that we invest time each year in our financial education. This also means sacrificing a Saturday or an evening instead of being with the family. One of those activities to learn about stock investing is to attend conferences organized by VFB, the Flemish federation of investors. URL www.vfb.be
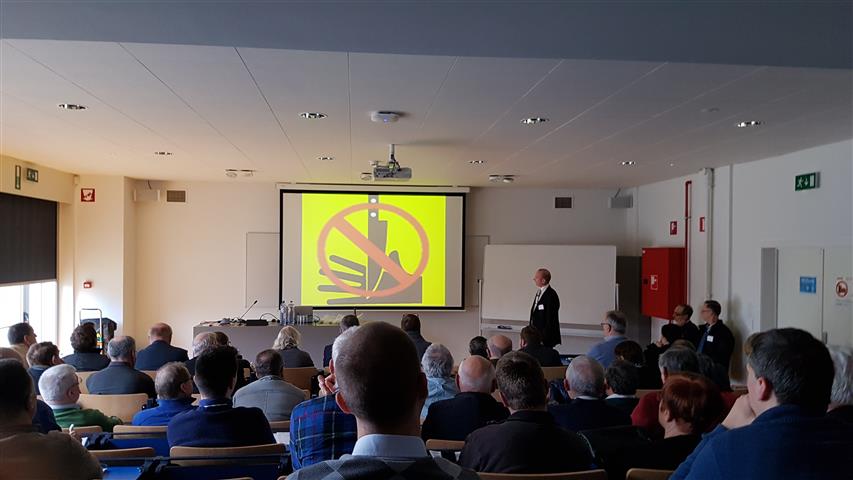
On the 18th of February, the VFB organized a Technical Analysis (TA) day where different speakers came to speak about different TA methodologies, strategies or software. This is the second time I attend this event.
You can download the presentations here in the appendix. Below you can find our notes and comments for the presentations we attended.
This article has 4 sections:
- Presentations Notes & Key learnings
- People we spoke to
- General conclusion
- Appendix . Presentations in PDF format and link to VFB
Section 1 : Presentation Notes & Key learnings
The day was opened by a warm welcome of Patrick VERELST, afgevaardigd bestuurder VFB. He mentioned that more people in his friends and family are interested in investing in the stock market.
Below you can read the summary notes of the presentations we attended. We add Our Comments at the end of each session
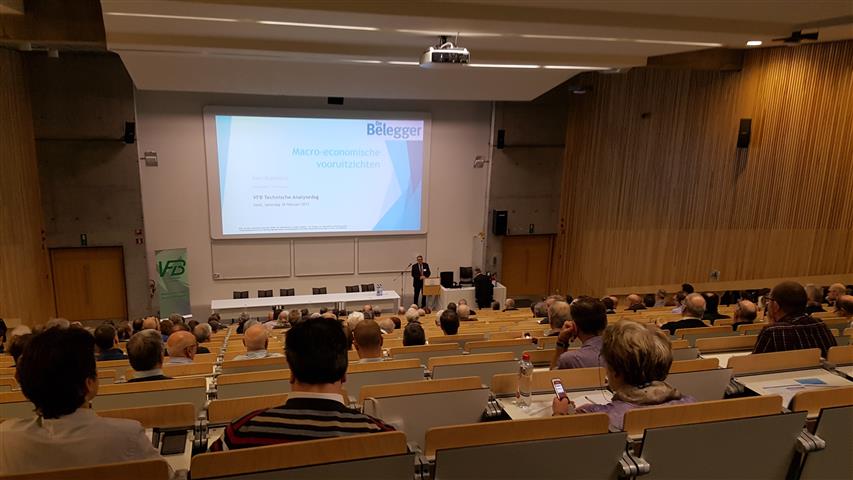
General session: Macro-economic Forecast
Speaker: Gert BAKELANTS, hoofdredacteur De Belegger
The first session by Gert Bakelants of the magazine De Belegger + Beurssignaal opened with the confirmation of the consumer confidence and improving economic forecast for the European companies. There is a positive dynamic going on. All positive signs for the European stock market are green. Even in weak countries such as in Italy. Companies keep on investing and banks keep on lending credit to consumers and companies thanks to the ECB policy.
Is the positivism too big? There has been great optimism and growth in the USA. Is this due to the factor Trump who says that he will invest big in infrastructure projects? More people are pointing to the stronger dollar which makes it harder to export for US companies and also the debt ratio keeps on increasing to record highs. So be aware of US highs…
See the evolution of the employment in the US and then evolution of the S&P500. Gert shows a graph where low employment rate is in relation with high stock market highs. Today employment is below 5% and the S&P hits market highs. Food for thought going forward. Of course with graphs you can proof everything…so keep this fact relative into account going forward. Today there is low volatility. Is this silence before the storm? Will there be a correction of 20% going forward? Gert shows a graph with the number of days without any correction. He again says…”do we need to careful? It gives us food for thought!”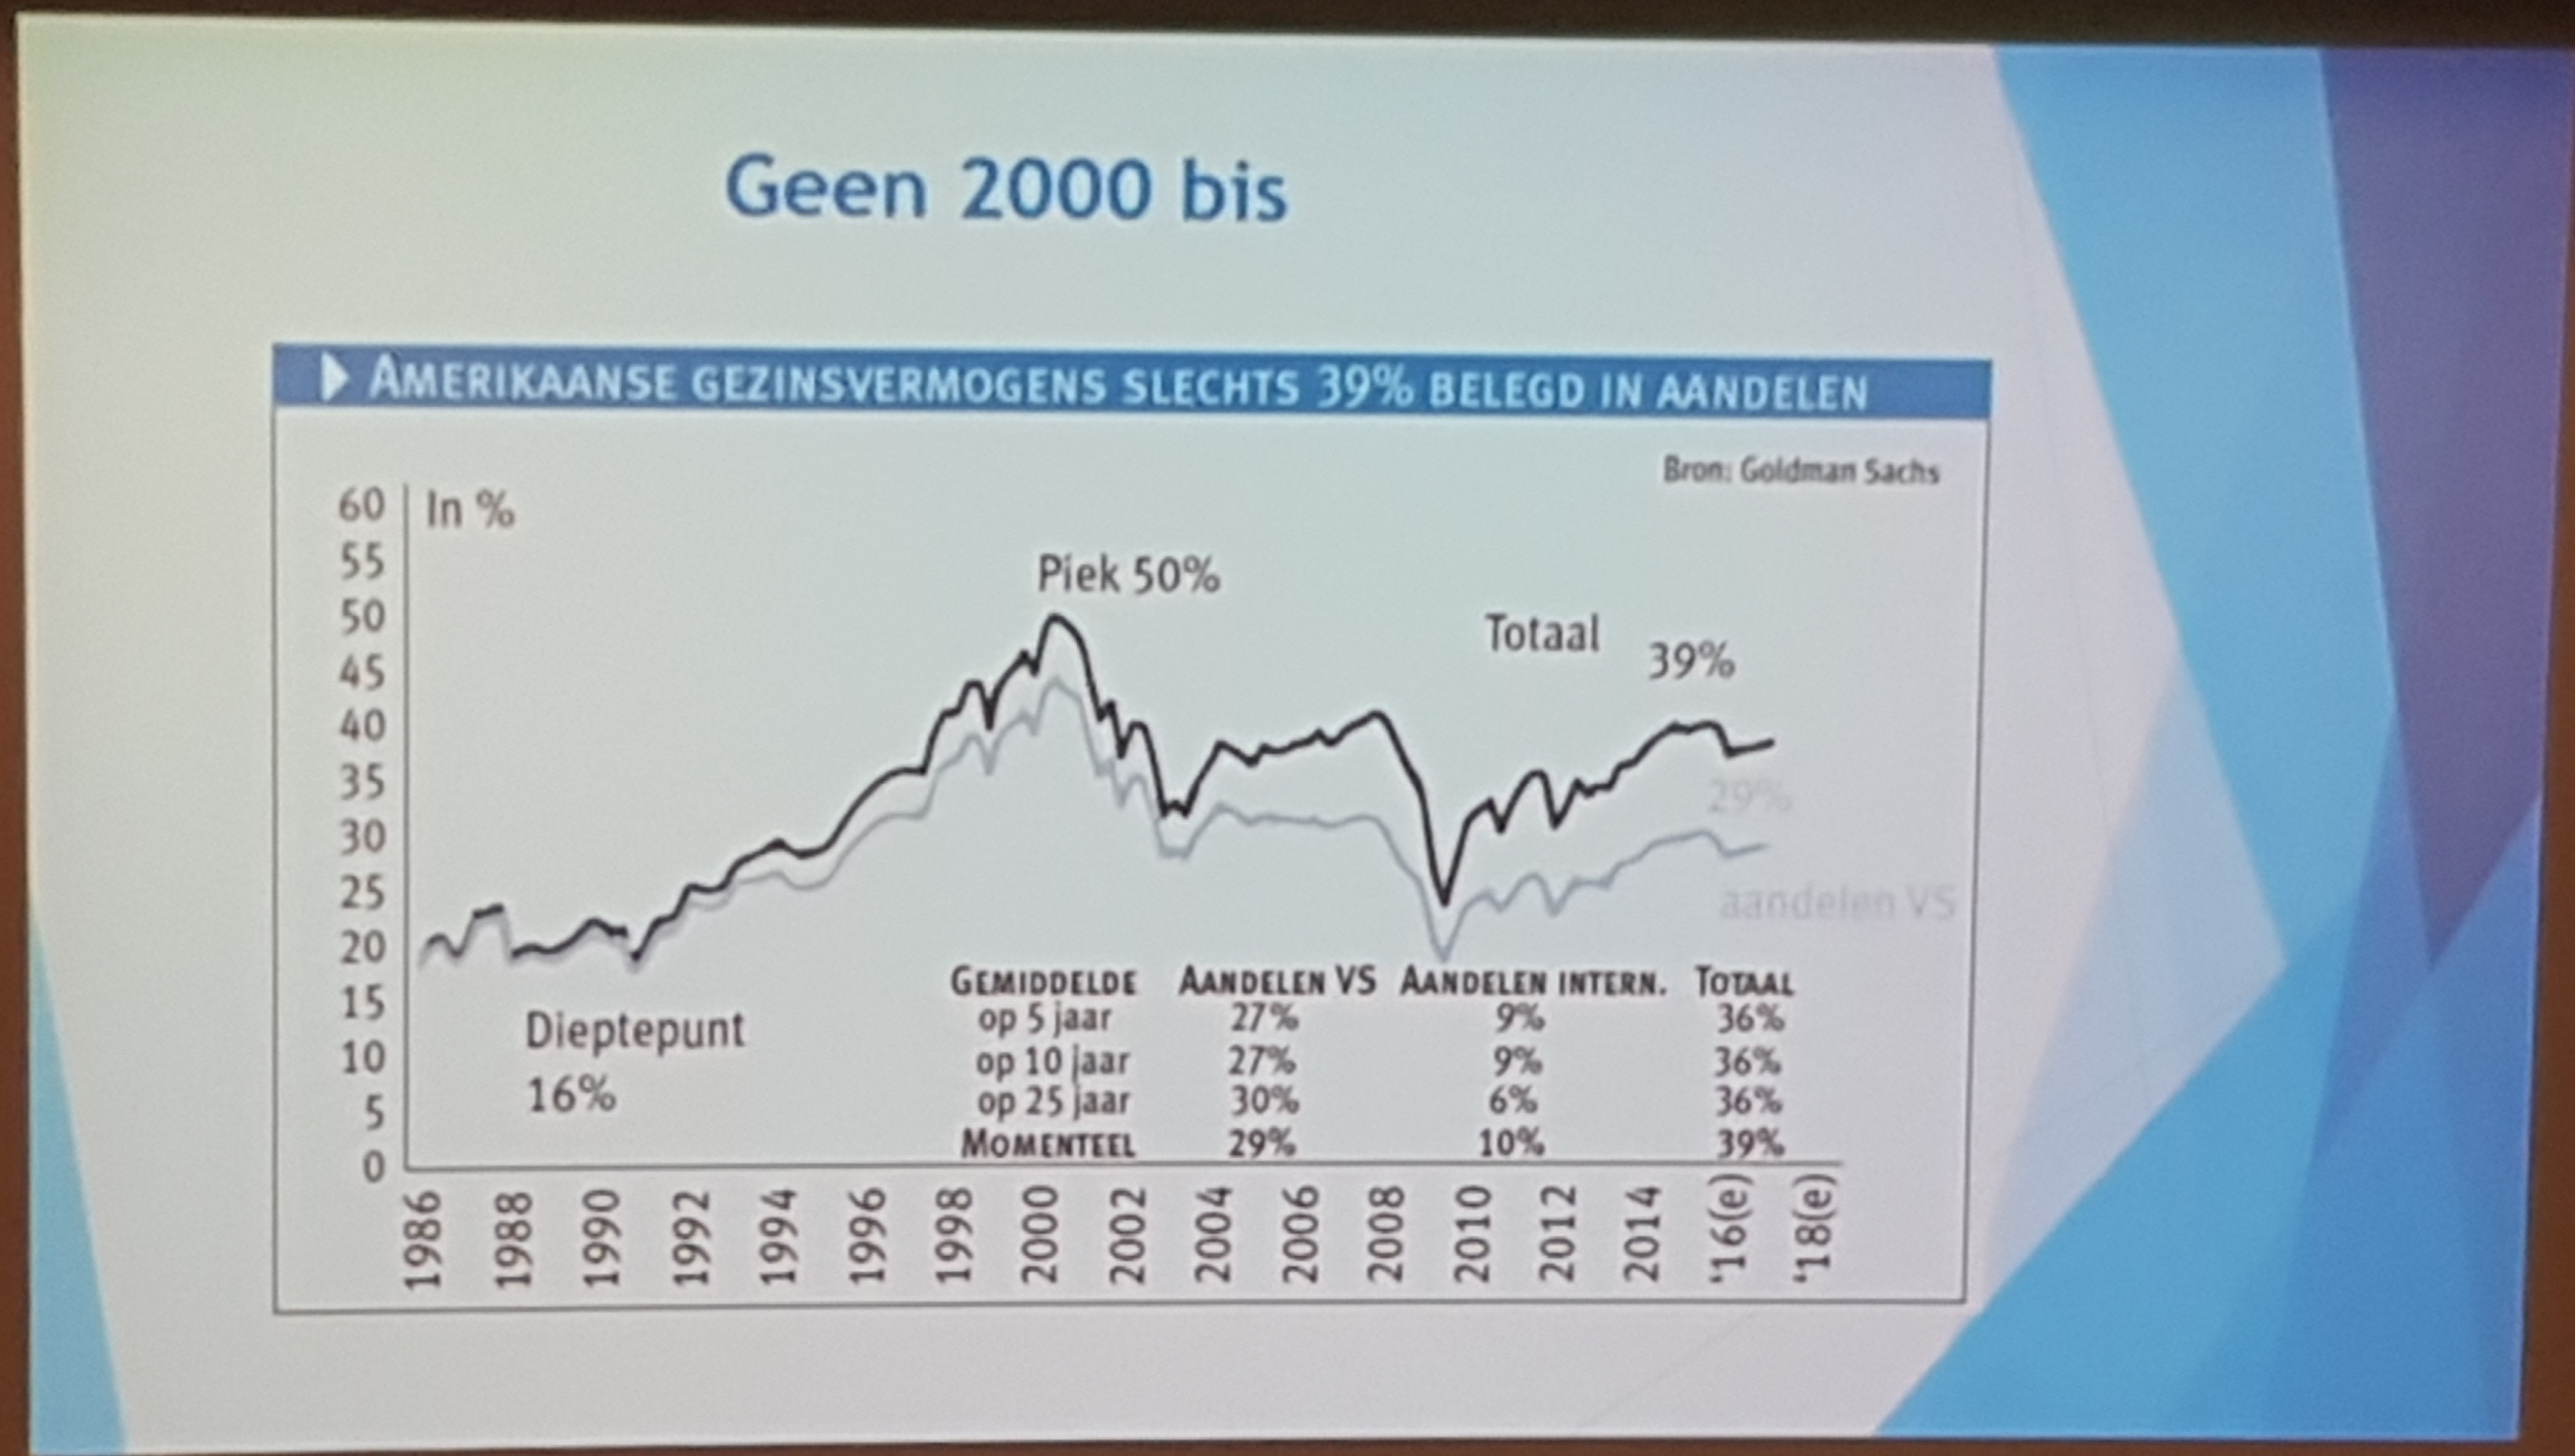
Today we are record high of cash flow versus record high prices at the same level of 2000. Put this graph in his context and be aware that we are record highs. But you can be also positive. The current bull market can also be stronger going forward. One analyst said that we can go higher another 10 years…
Basic materials prices are going higher which is a positive signal for the stock market, also the transport index broke through. Another indicator is the sentiment indicators. Today we see that only 39% of American families are invested in stock market. In Belgium this is much lower…there seems to be higher interest in investing in shares. Also American families are looking to invest in foreign stock market.
Today there is a preference for Europe as EU stock market index is still a lot of lower than US indexes. There is still a lot of potential to go higher but that is no guarantee. In Europe political risks have increased as there are many elections in European countries.
The highest risk is the interest rates. This is increasing even in Japan. ECB will next month buy 80 billion and decrease it to 60 billion going forward. Slowly tampering… Longterm interest rates are going up which may pose a risk to the market indexes. This is according to Gert the highest risk to the market.
Is this a positive element a higher interest rate? What if you have a large bonds portfolio? What happens with bonds if interests increase? They decrease and go lower. But most important inflation goes up….everything goes up in prices and becomes more expensive. Can we go even higher to
Gert also highlights that people in Belgium are getting poorer due to a higher inflation rate and low interest rates. Governments want to keep interest rates low as this keeps the government debts lower. How do we make debt lower? By increasing the inflation rate…financial repressive solution that has been going on for the past 7 years and where people get poorer without realizing it.
The same as the Toblerone chocolate bar where people got less for the same amount of money. This is the same as inflation. Have you seen the Lotus Bakeries cookies Madeleine? They became smaller and smaller in time…(laughter in the room)
One important advice from Gert : don’t put your money in fixed interest government bonds. This is the same as loosing money. But Gert says..: Most people and families in Belgium don’t realize and get fooled in this trap of the governments.
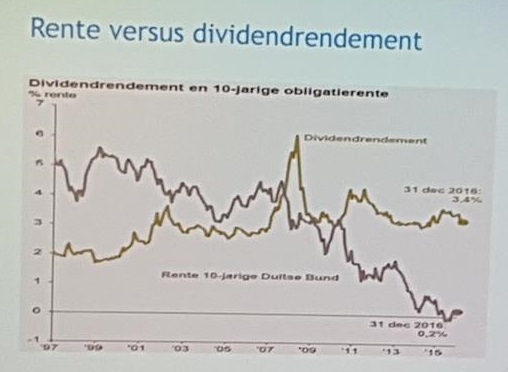
When was the crossing of dividend income versus interest rate? “See in 2008”, says Gert. Now dividend return is MUCH higher than the interest rates…
Don’t put your money in shares that are interest rate sensitive. This applies for real estate funds that have been profiting from low interest rates. Should we now pay for high priced real estate investment funds? Be aware of the risks…
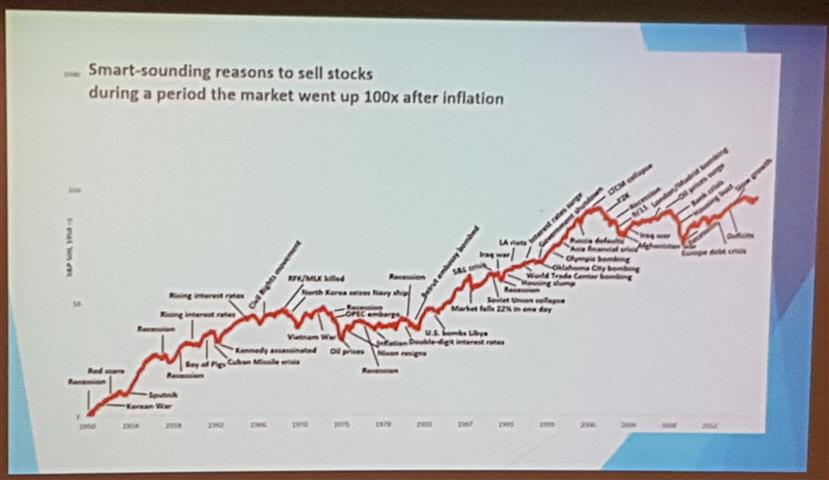
When you look at next graph, you see an increasing stock marke
t. By investing 1 euro and risking this 1 euro , you will always get a higher return within the stock market. There will always be a crisis. Just look at the crash of 1987. A crisis is always an opportunity to profit from… . Technical analysis is therefore important as there’s saying “The trend is YOUR FRIEND”
Warren Buffet also says :The stock market is the same as sex. The best moment is just before the HIGHS”. This results in another time in laughter amongst the audience.
Our comments:
The presentation of Gert BAKELANTS, hoofdredacteur De Belegger, did not contain many surprises for us. On one hand he was positive for the possible higher stock indexes in Europe (and the US) and at the same time he constantly warned for the record highs in the USA.
Additionally he talked about the inflation and the dividend return. About the inflation, he confirmed what we wrote in our older blog post where we said the same. How you get poorer without realizing it.
One key learning for us was the fact that only 39% of the US families have invested in the stock market. I believe that it is due to two reasons. Real estate (buying an affordable house) was main focus for families that we know in the US. Middle class families had a rough time due to the financial crisis and remain cautious. In Belgium the situation is even worse about investing in the stock market. Gert’s comment that a return of 7% per year was possible in the stock market but you also need to ride the dips. That is a solid statement that many Belgian families are not aware of. If you had invested in a low cost Vanguard Index fund on the S&P500, your return would have been solid and strong during the past years.
Options strategy using Technical Analysis
Speaker: Maarten REDANT
Next session that I attended was the Option Strategy in combination with Technical analysis. Maarten has 6 topics and starts with some basics.
Bull vs Bear market
The bull is the increasing trend as he throws the matador higher..this gives a trend line where you can touchBear slams his victim lower. This gives a sell point on the trend line.
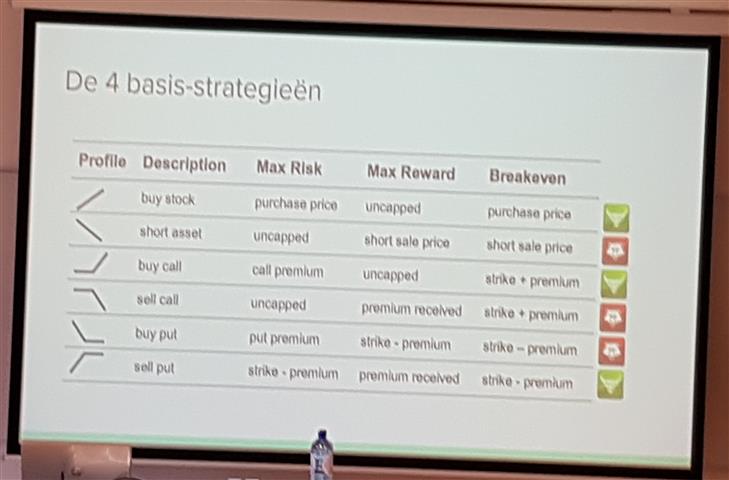
See the 4 basic strategies which you need to master according to Maarten for options trading
Technical analysis
What does it mean? It is drawing of lines and patterns. It is all about support and resistance levels. Trend channels can be drawn in week, month and day bars. Use algorithms to search Bull flags on www.chartmill.com using shared screens as an example. Implied volatility is a common used indicator for options.
Options and TA
How to combine both? Most important is option implied volatility. This is standard on the graph.
If stock price goes lower, then volatility goes higher. Also historical volatility is important. Open contracts are important. Option Volume and Put/Call ratio are also on the graph.
Draw expiration options on the graph. OI (open Interest) Many calls out of the money and many put out of the money. The goal is to maximize the expiration many calls and many puts.
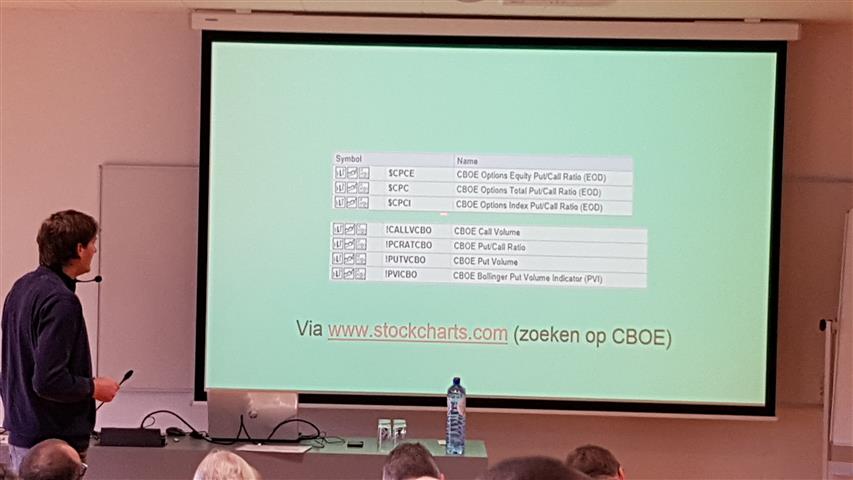
You can use www.stockcharts.com where you can look at the stock market sentiment and where you can look at the CBOE indicators.
What do we know about the future in options? We know the expiration dates in the future and the open interests per cycles. Of course there are always market triggers that can impact market sentiment and the stock market. We know the dates of those market triggers. Geo-political events can trigger the market. For options the implied volatility is impacted by this
Decision makers : price spread and Open interest are key elements to review. Key to learn is the 4 basic strategies. In the Questions section, Maarten syas he trades in the SPY & AEX due to volume. He uses Interactive Brokers as trading platform
Our comments:
As we are still newbie in option trading, this presentation was useful. It shows the necessary skills for options trading. The choice of the platform is important as you need the right indicators and information. We are interested in options trading to complement our dividend investing strategy. More information on this blog once we have all mastered our first steps.
Technical analysis is important in options trading. No question about that!
The Sky is the Limit!
Speaker: Mark SCHILS, CompuGraphics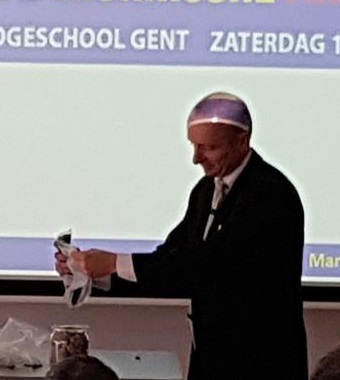
Next session that I attended was “The SKY is the LIMIT”. The session started with Mark putting potatoes into a jar. Now question to the public : “the jar is full or not?” Now he adds smaller materials..is it now full? Then he pulls out another bag with earth…and adds another material. And the jar gets fuller and fuller…”now is the jar full?” he asks… Then he pulls out a bottle of beer….we could also add liquid and add more…
Where is the analogy?
The potatoes are trend investors who want dividend and just want to invest in the trend. The smaller stones are counter trend investors investing in shares and they need closer follow up. The black earth are the day traders with trackers and turbos or futures who closely follow up and trade within short timeframes.
According to Mark, focus on shares that are in an upwards trend. They are the easiest to follow up as the trend is your friend. Focus on the potatoes.
The pit is endless slide means that a share can always go lower. But also the Sky is the Limit can be true. It depends where YOU step on the ladder. We don’t want the pit. What can technical analysis do for you? Is it complicated? You can make it complicated if you want by learning about Elliot waves but Technical analysis is no EXACT science! Technical analysis is just a tool to know your Entry and EXIT points. Mark stresses out :”Keep it simple”
First analysis is the market sentiment where you can see whether it is positive and green. This shows you in which indexes you needed to invest. Mark highlights that investing in US indexes is still preferred.
How do you start with trend investing? Of course you need to buy at the bottom before the trend goes higher. Most investors are dreaming and want to wait for big increases and always want higher prices. Eventually they might need to sell at a loss in the long term. Never add shares when shares go lower. Only buy when the trend changes at a TRUE BOTTOM. Never touch a FALLING KNIFE !
MACD indicator works only in an upwards trend. This doesn’t work in sideways trend. RSI works in a sideways trend. RSI indicator needs to be above 50 for a strong share.
But always use a STOPLOSS and safety line! And keep it always simple. An example is the RENKO graph that eliminates the ups/downs on a time scale. It shows clearly the trend.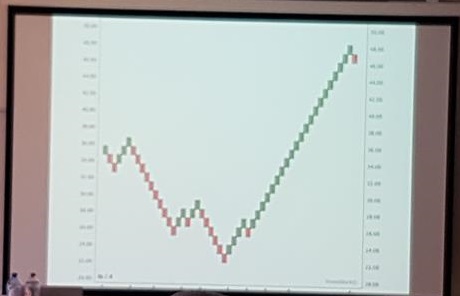
Stock Picking : how to execute? Use the relative strength indicator. Look whether a stock performs better than the index. When the market goes higher, the stock price goes relative higher than the index. This is typical for strong shares. An example is Adidas.
Mark’s advice :
- BUY ALWAYS SHARES AND TRACKERS THAT PERFORM HIGHER AND BETTER THAN THE INDEX IF YOU ARE A TREND INVESTOR
- INVEST IN THE SHARES THAT ARE IN EARLY TREND GOING HIGHER WITHIN A NEW CYCLUS
What is typical for strong shares? There is no limit so the share price can go higher as there is no resistance.
Examples and tips : BARCO, RECTICEL that may have an upwards trend.
Our comments:
If you are a swing trader with a LONG BIAS, all recommendations that Mark gave are correct. Don’t average down and respect your stop loss. The RENKO graph is useful for longterm swingtrader dependent on the timeframe that you use.
Mark also talked about the use of the RSI & MACD indicators for swing trading. As trader, learn how to use them! According to us, support and resistance levels are more important than the RSI & MACD indicators. There are so many indicators that can be used but none of them are exact science! Technical Analysis is not a science ! This is the only correct fact. Keep it simple is KEY!
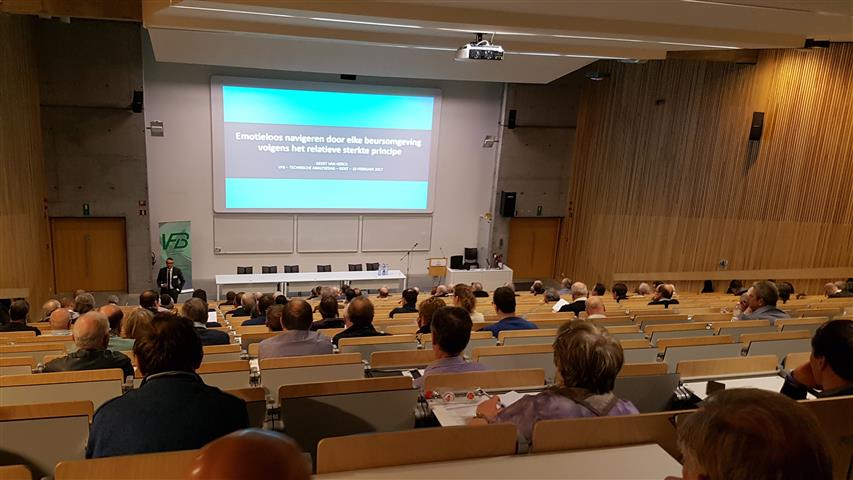
Navigate without emotions in any stock market climate using Relative Strength principle
Speaker: Geert VAN HERCK, Chief Strategist Keytrade Bank
How to invest without emotions? Why?
Geert starts with a technical outlook for the stock indexes. MSCI All countries. New records are being prepared..resistance level at 443 points. The bull market may not be over or we can retreat to the resistance level of 352 points. RSI indicator is still not overbought and we are in strong upwards trend. The same applies for the S&P500. Historic highs and this scares some people…why? Gert still believes we still have potential going forward.
Cash positions of Fund managers in the US are low which indicates that they are almost fully invested and this is positive. Everyone seems to optimist. All lights are on GREEN. Of course it can always flip back to Orange if you are a contrarian.
Emerging markets did not see this upwards trend. They went sideways. There are still opportunities if you look at specific countries. There is still potential going upwards dependent on what happens in the US stock markets. Now optimism still prevails for emerging markets. Very interesting to keep watching and follow up.
Now back to shares…interest rates of US 10Y are back going up. The decreasing interest rate trend is finalized and now we will go back in an upwards trend. The trend has changed.
Gert believes that in a diversified portfolio bonds need to be present as a shock catcher element in case of higher volatility. But limit the percentage. Commodities are also back recovering since 2016! An upwards trend is expected beyond the 195 points. Developing countries are growing again which cause an increase in buying basic materials and commodities. You can see this in an increasing copper price.
Gold trend is positive. Further recovery of the gold price is expected. 1400 USD remains realistic.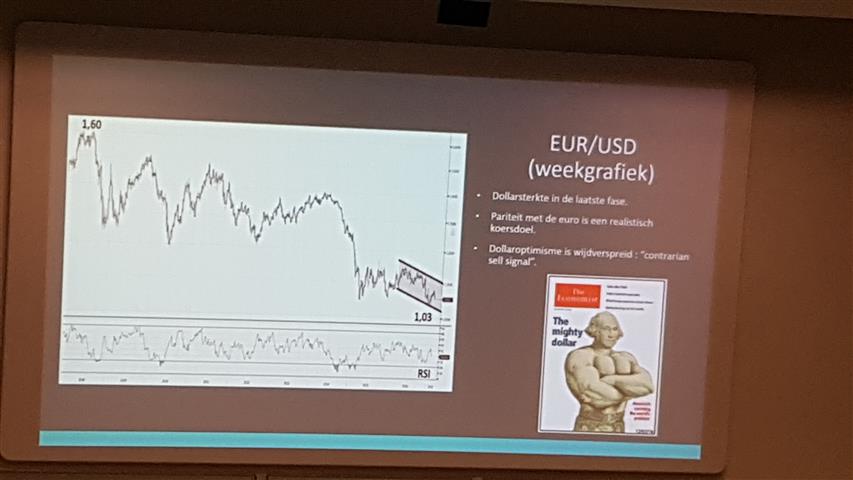
Finally with the EUR/USD graph. Key fact is that: “the dollar is already a few years strong”
In the Economist cover, you can read that the dollar will remain strong going forward. This is a clear sentiment indicator. Parity with the EURO is a realistic target.
Why invest without emotions?
Why do many investors fail? Main reason is because investors are influenced by press articles and buy high or invest with emotions.
Here some examples of press articles
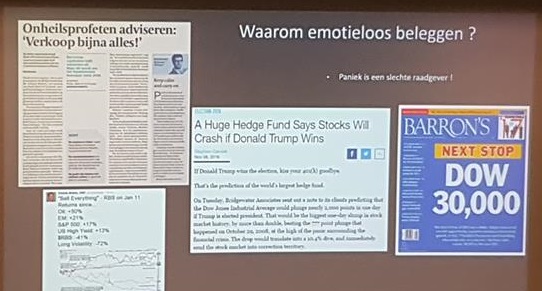 .
.
Don’t invest WITH EMOTIONS ! This is the greatest advice. Below you find the 3 MOST IMPORTANT WORDS in INVESTING according to Geert.
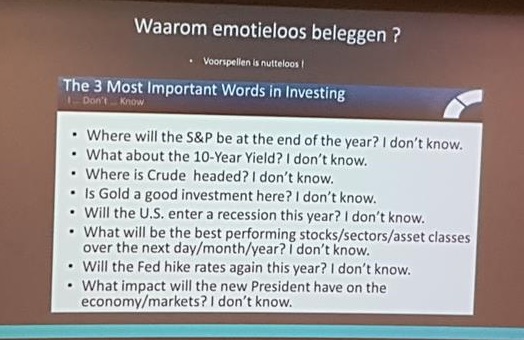 .
.
So how do we solve this?
- Use the method FABER. This is a simple methodology.
- Use the method Dual Momentum Investing from Antonacci. This methodology looks at the total return. Return must be higher than the cash rate.
Gert is happy with a return of 7-10% per year basis.
When you combine the two methodologies, you can see the following returns. For example: Invest every month in the top 3 of the strongest ETF’s for that month. The combination of Faber and Antonacci would show you to stay or step out of the market. No model is perfect tough.
A simple model : Eight trackers and then invest in the top 3 each month. Be disciplined and keep it simple! And eliminate your emotions!
Our comments:
The general technical outlook was very similar as the presentation of Gert Bakelants. Honestly we are surprised that Geert still recommends to invest in bonds as a shock buffer. This is clearly in contradiction with Gert Bakelants who strongly advises against. We also believe investing in bonds is really BAD ADVICE in an interest increasing climate. We don’t understand that and other investors we spoke to during the day had the same comment. There are better ways to put your money at work.
The method Faber and Antonacci may be a great tool for ETF investing. We are not familiar with it. There may be merit to it for those who use it but it does seem a bit complicated to me, as a small investor. We don’t make a judgment about it. Keep it simple ! We prefer our dividend investing strategy which gives us a recurring return of 8% from our high dividend stocks and ETF’s.
One Tesla for stock lovers!
Speaker: Paul GINS, zaakvoerder CompuGraphics
Paul GINS is a SPEAKER since 13 years on the TA VFB Conference.
What is a trading system? Today Paul will explain how you can make and use a robot system. A Robot Trading consists of the following steps.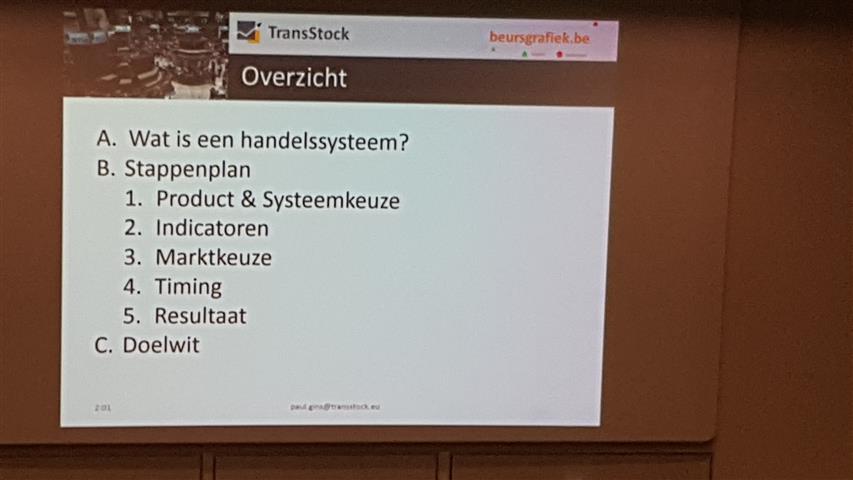
What do you want to invest in? Make your choice. This is dependent on your risk level. First key element is Risk management. Secondly. System choice. Paul’s preference goes to LONG & TREND. Here you also need to analyze as well your risk management based on your choice.
On the following graph you see great trend. When you trade with a trend, there are less transactions.
Indicators are important to make a choice. 5 indicators are MOST IMPORTANT to make your choice. These indicators are Trend, volatility, momentum, volume and speed. There are also fundamental analyses indicators. You can combine technical and fundamental analyses indicators. An interesting ratio is the pessimistic return ratio. The portfolio return ratio higher than 2 is key and higher than 2,5 is excellent. You can find videos and books online from the author….
YOUR main Objective should be :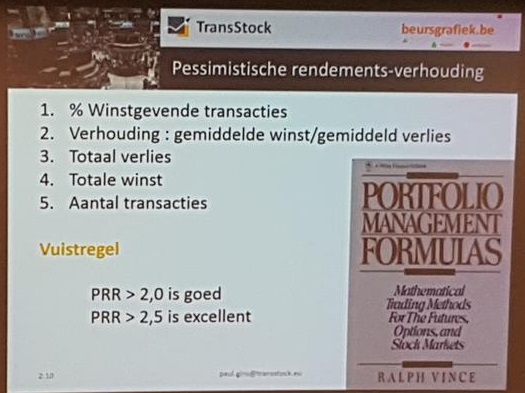
- Maximum profit
- Minimum loss
- Minimum transactions
Less important is a higher profit rate versus loss rate.
Next choice is where we will apply our system. Which market to chose from? The market choice is dependent on 7 conditions. Paul lists the 7 important criteria for the selection of the market.
On following graph you see the different indexes. How trustworthy is the index or market you invest in?
Next choice is timing. One day we will meet the bear. Timing is market sentiment. If the market sentiment is negative, don’t invest in the market.
According to Paul, you need to automate your portfolio with your ROBOT. And this robot needs to benchmark. You also need a robot for your portfolio management. This robot takes care of the following three actions
Next ROBOT : Portfolio management
- Buy & Sell
- Cash optimization
- Sector spread
Paul uses three examples to show the three tasks of the robot. 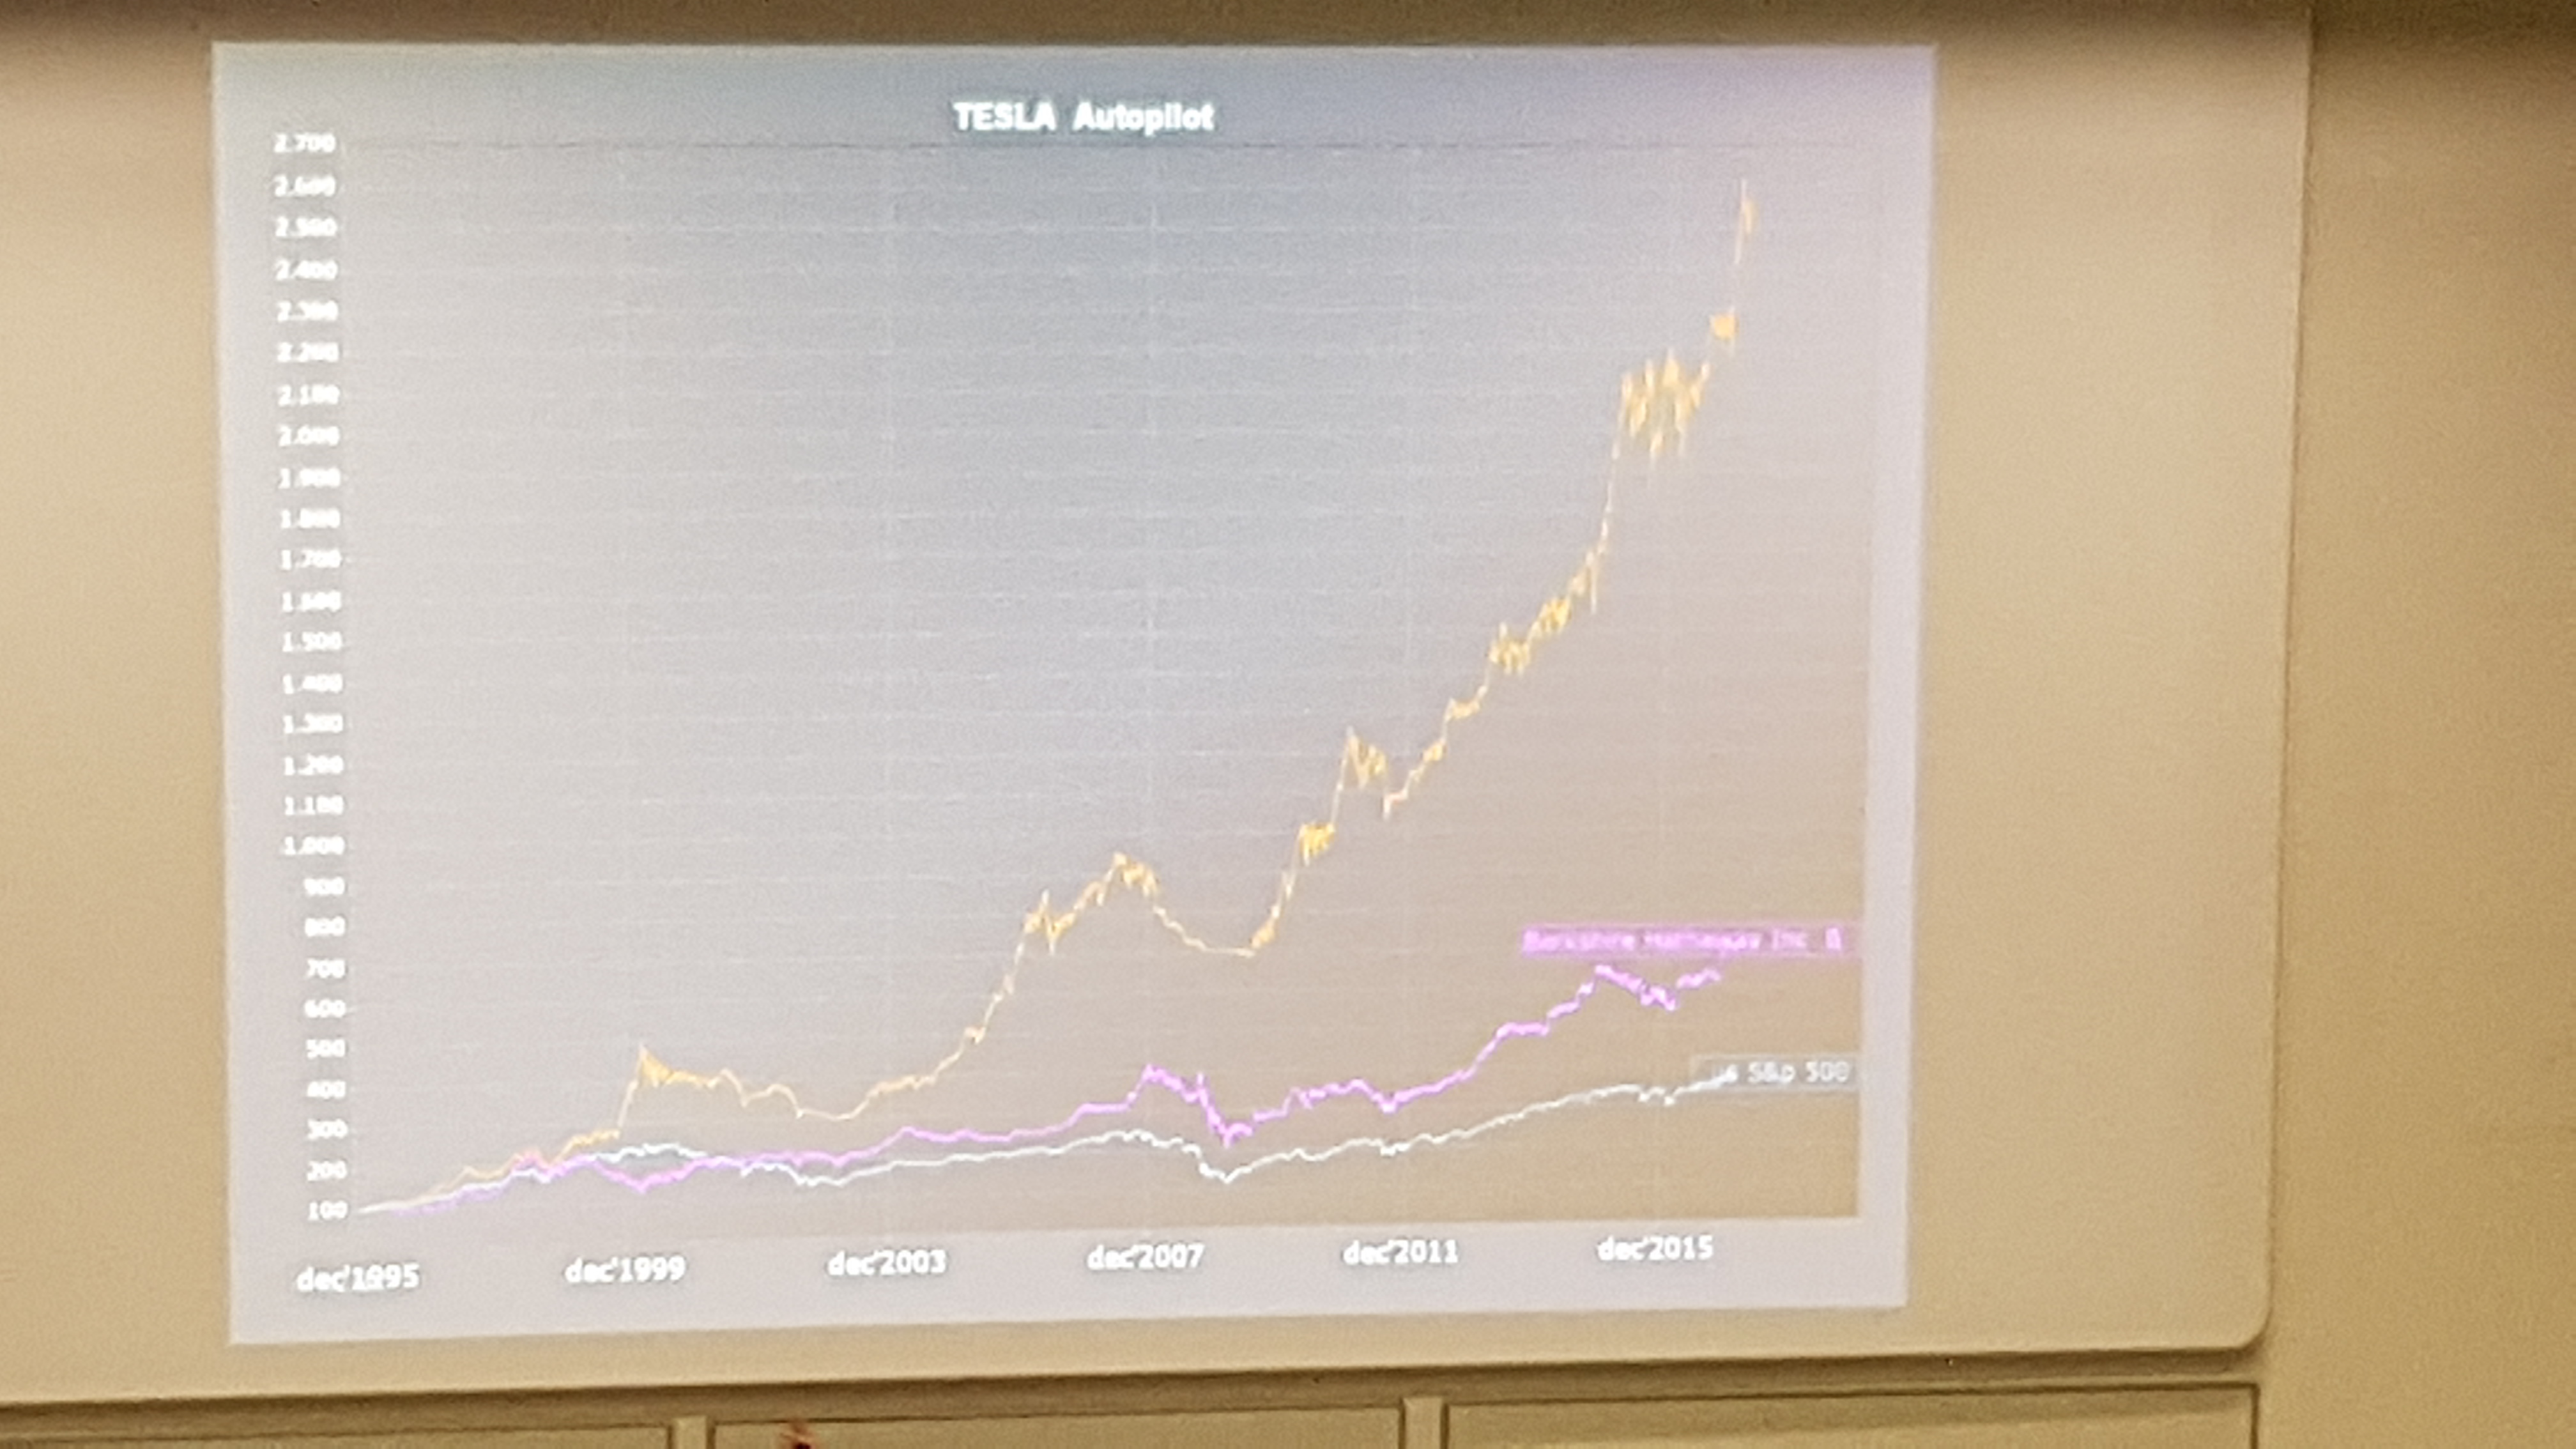
- Buy & Sell strategy
Example : BEKAERT when it broke the trend.
Optimize your buy & sell is your task of ROBOT 2
- Cash management
Example : dividend shares with 5%. Cash on time when shares go down and end a downwards trend.
- Sector spread
Focus on the strong sectors and pick a few shares per sector. This is the task of the ROBOT.
Objective : automatic trading & performance
What do you see in 2008? The system went back to cash and didn’t invest.
Paul ends with a slide which shows the ROBOT Tesla on autopilot performance against the performance of Warrant Buffett. And with the quote “If people asks you whether you invest in the stock market, you say…I have no time for that…my computer does it all”
Our comments :
Paul is always a great presenter and presents long trend swing trading as a very simple approach. Of course with software it is more easy to do. This was in a quick nutshell what the necessary steps you should execute as a swing trader. I wouldn’t leave it up to the computer to do the decision making as stocks can have irrational ups and downs. You don’t want to be stopped out in one day.
As Transstock software user, it will be interesting to follow up if those robots are available in the software. To be continued…
Higher return without higher risk through investing in region or sector based ETF rotation analysis
Speaker: Etienne VERHELLE, independent technical analist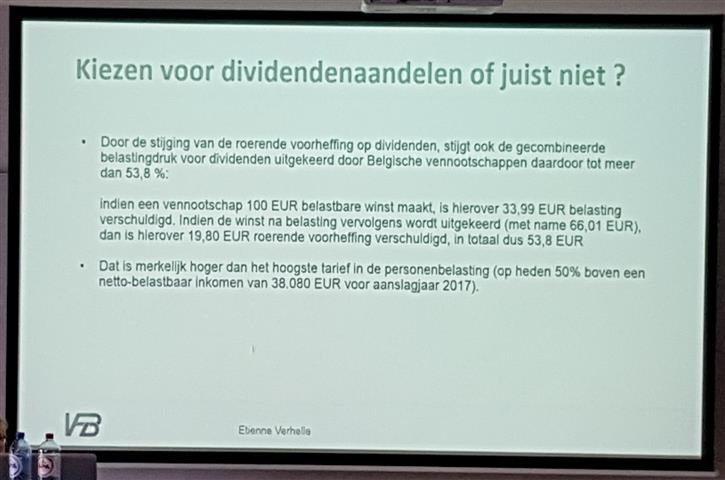
Transport index & Dow Jones is in an upwards trend. Low management costs improve your return performance Under Obama US stock market has shown the best performance ever seen.
First TRUMP ETF has been introduced with ticket XMX. Low cost ratio with 0,3% with 58% US stocks.
Chose for dividend shares or not? According to Etienne it is better to invest in ETF’s or shares and focus on capital gains. Now he only invests in ETF’s !! S&P tracker VO with 0,05%
We didn’t finish this session as we left early the room for the Top 10 picks.
Our comments :
We also believe in investing in ETF’s. But we don’t agree with the argument placed on the slide of the dividend shares. It is correct from a tax perspective for a company and that’s why most Belgian companies have a bad dividend policy. This can not be used as argument for NOT investing in dividend stocks or Closed End Funds. We know as a fact that there are high dividend stocks where there is no foreign country tax and where you profit from a reduced tax rate.
The perception and conclusion created by this slide is WRONG as argument for switching fully to investing in ETF’s !
Inside Beleggen TOP TEN PICKS
Spreker: Marc BREMS, technisch analist Beurssignaal
The session started with a general technical outlook. Copper price is indicator of positive sentiment and improving markets. Oil price has recovered. Another indicator is the transport index. This is positive signal again for the markets. Gold price outlook is uncertain.
Eurostoxx50 is since January 2017 broken out and gave a buy signal. There seems to be more potential in the European markets compared to the US markets. The AEX index has broken out and looks for new highs.
Sectors to look at: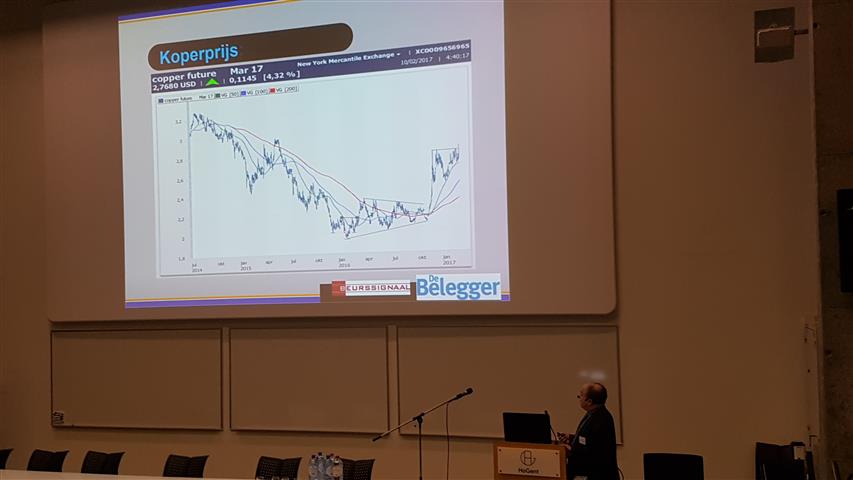
- Telecom
- Utilities ex. Veolia
- Retail ex. Ahold Delhaize, Carrefour
Example of ETF trackers for those sectors
Tracker SPDR MSCI
Lyxor ETF Retail
Emerging markets have also seen an outbreak to an upward trend.
TIPS TO BUY
- Carrefour
- Vivendi
- Veolia Environnement
- Cisco Systems
- Quest for growth
- EVS Broadcast Equipment
- Fugro
- Euronav
- Hongkong HK0000004322
- Stock exchange of HK is positive upwards trend
- iShares MSCI China tracker is the best tracker today
- Global X Andean (Ticker : AND)
- Benefit from the Chile, Peru and Colombia growth potential
Because Fugro & Cisco are questionable tips, final extra TIPS have been given that has been given is
- BinckBank
- Tessenderlo Group
Our comments :
We can not follow the decision making process of Marc Brems using Technical Analysis for his 10 tips. I would love to have seen his performance of the 10 tips he gave last year…why didn’t he show that? We personally don’t believe in his explanation for some of his tips. The technical outlook of the graphs doesn’t support his explanation. He more uses fundamental analysis and company information to justify his decisions.
We don’t believe personally in the tips of Quest for Growth, Vivendi and Carrefour. We do have Euronav in our portfolio for the dividend and for the potential upward potential with a strong 2018 outlook. The stock bounced from the resistance level.
Cisco is a buy if the trend continues. The trend is your friend. Although CSCO has an excellent technical rating, it does not present a decent entry opportunity at the moment. Prices have been extended to the upside lately. For a nice entry it is better to wait for a consolidation.
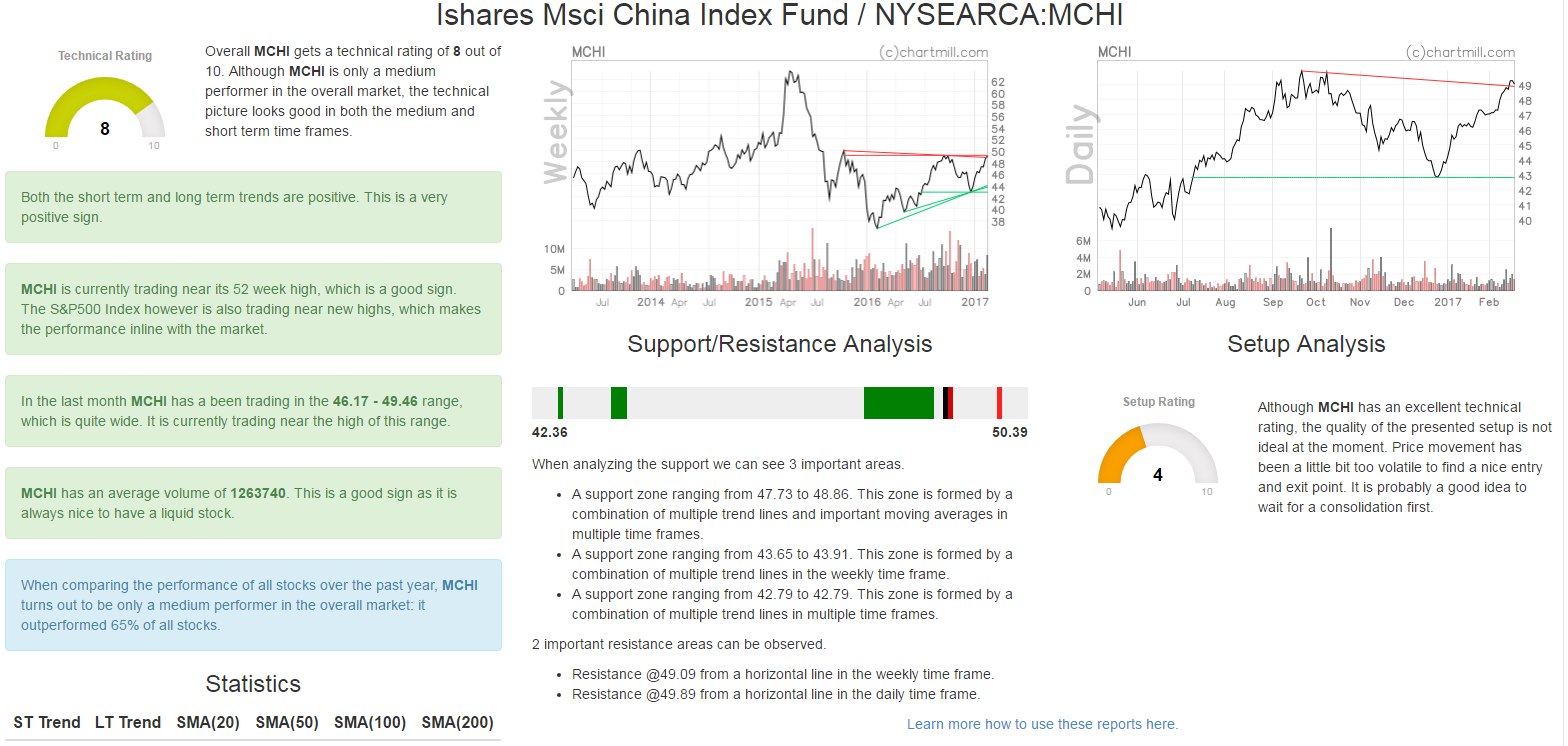
We did run a technical analysis for the two ETF tips MCHI and AND on www.chartmill.com
The Ishares Msci China Index Fund has been a little bit too volatile to find a nice entry and exit point. It is probably a good idea to wait for a consolidation first. See the complete analysis rating below.
The Global X Ftse Andean 40 ETF has a better technical setup and contains a trading setup. See the technical rating
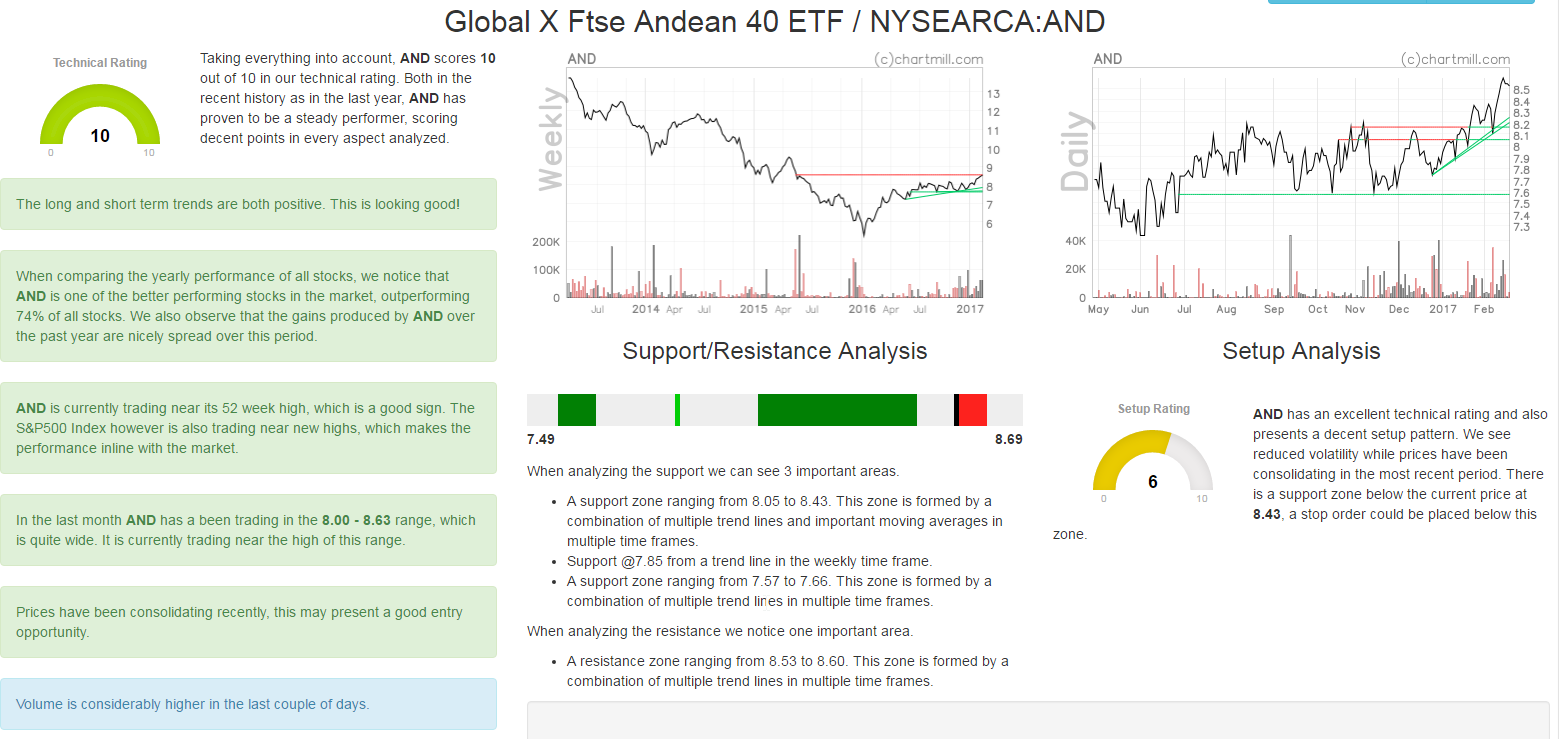
The possible trading setup on the ETF AND looks as follows
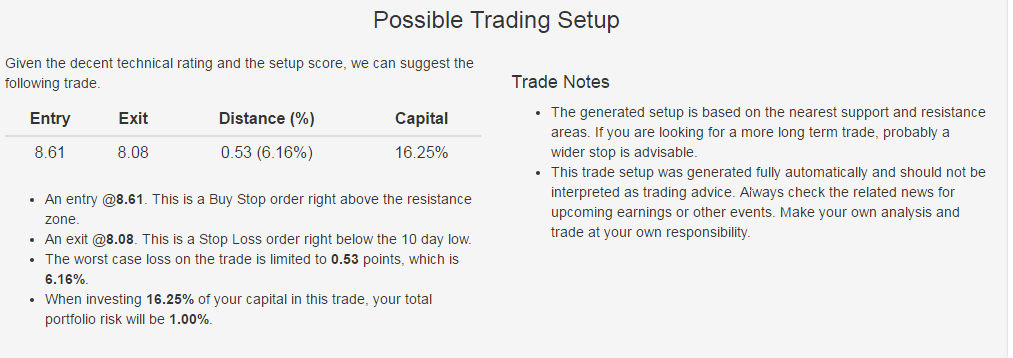
Honestly we have a mixed opinion about the 12 tips given by the analyst Marc Brems. We would love to see next year how his 12 tips performed if he’s on stage again during the Technical Analysis conference of the VFB. Everyone can judge for themselves whether those tips are valuable tips or not.
Section 2 : People we spoke to
During the conference we spoke to several people. In the morning we had an interesting conversation with a person who works in a bank. He told me that from the 300 people working as agents for this bank probably 30 know something about investing in the stock market. Although friends and family were asking him for advice how to invest in the stock market, he felt reluctant to do so in order not to disappoint them. At the same time he was instructed to sell products (funds) that he didn’t even understand himself. He said that funds from the same bank were the worst performers in 2016. This is again confirmation that we have a real problem with financial literacy of people and the attitude of some commercial banks. Unfortunately people working in a bank who want to advise in the best interest of people have two choices : sell what they are instructed and trained upon, or don’t sell and then their salary gets reduced. Hard choice to make…
We also spoke to some students that were present during the conference. Although the amount of students was less than last year, the few we spoke to, were very interested and motivated in learning how to invest in the stock market. Let’s hope they succeed.
We also spoke to other investors and how they invest. It’s always interesting to learn from others.
Section 3 : General conclusion
With more than 200 people attending the TA day, we believe this day organized by the VFB was a success! Congratulations to the organization.
We do have some tips how this conference can improve even better in the future
- Some presentations had exactly the same general outlook with slides and information being the same. For three speakers we heard 3 times the same story. It may be wise to limit the general stock indexes outlook for the speakers and let only ONE speaker give a GENERAL stock indexes review and forecast. Review the presentations of the speakers and cut out the content which is a repeat of the general session.
- Networking possibilities. As I attended many conferences in the past, it may be an option for people to share their contact details and experience with trading. Investors could describe their trading or investing profile and share it with others. As a result, you can find investors with the same strategy as you and learn from each other. Or maybe you want to learn from someone who has a better strategy than you and you want to learn. It is called Opt In/Opt Out. If you don’t want to share what you do, you simply Opt Out. Information sharing and learning from others is important !
Keep up the good work ! See you next year.
Appendix : The presentations
Below you can find the presentations in Dutch.
1.1. Macro-economic outlook by Gert Bakelants. Gert Bakelants. Gert Bakelants
1.2. Price protection Agriculture by Johan De Hertogh.
1.3. Best of both worlds by Wilfried Voorspoels
1.4. Navigate without emotions in the stock marketby Geert Van Herck.
1.5 The Sky is the limit by Mark Schils
1.6. Technical analysis useful ? by Rombout Kerstens
1.7. 10 Investment tips by Marc Brems
2.2. Options strategy by Maarten Redant
2.3.RSI & MACD explained by Philippe Dassonville
2.5. The investment strategy of Edward Loef
No Comment